WinSavvy Editorial Standards
How this article was created
In the boundless galaxy of data analytics, where stars of insight are waiting to be discovered, the choice of your analytical tool is your spaceship. Two crafts are vying for the chance to be your vessel on this journey: SAS Visual Analytics and Woopra. Each offers unique features and capabilities to explore the data universe, but which one will be the most trusted companion on your quest for knowledge? Whether you’re charting unknown territories of customer behavior or seeking to uncover the mysteries within vast data landscapes, this guide will serve as your navigator, helping you decide which analytics tool is the best fit for your mission.
| SAS Visual Analytics | Woopra |
|---|---|
 |  |
| G2 Score -4.4 out of 5 | G2 Score -4.4 out of 5 |
| TrustRadius Score -8.4 out of 10 | TrustRadius Score -5.8 out of 10 |
User Interface and Accessibility: SAS Visual Analytics vs Woopra
This aspect is pivotal as it influences how users across your organization can interact with the tool, uncover insights, and ultimately, contribute to data-driven decision-making processes. An intuitive and accessible interface ensures that valuable data insights are not locked away behind complex operations, making data analytics a shared and actionable asset across departments.
SAS Visual Analytics: The Sophisticated Explorer
SAS Visual Analytics offers a sophisticated interface that caters to users looking for depth and comprehensive analytical capabilities. It’s designed to serve a wide range of analytical tasks, from basic data visualization to advanced analytics. The platform provides a variety of tools and features that can be tailored to specific analytical needs, making it a powerful environment for users with diverse analytical backgrounds.
However, the sophistication of SAS Visual Analytics might present a steep learning curve for new users or those with limited analytical experience. The platform is best leveraged by organizations that have or aim to build a dedicated analytics team, including data scientists and business analysts who can fully utilize its extensive capabilities.
Woopra: The Agile Navigator
Woopra, in contrast, shines with its focus on agility and ease of navigation. Its user interface is streamlined and intuitive, designed specifically for tracking and analyzing customer interactions across various touchpoints. Woopra emphasizes real-time data analysis, offering a clear and concise dashboard that provides immediate insights into customer behavior, without overwhelming users with excessive complexity.
This focus on user accessibility makes Woopra an excellent choice for organizations that prioritize quick, actionable insights across teams, including those outside of traditional data roles. Marketing teams, product managers, and customer success specialists can all leverage Woopra’s insights to drive decisions, making it a versatile tool for enhancing customer experience and engagement.
Pricing: SAS Visual Analytics vs Woopra
The investment in an analytics platform is not just a monetary decision but also a strategic one, impacting the organization’s ability to harness data effectively while aligning with budget constraints and financial goals. Let’s navigate through the pricing structures of SAS Visual Analytics and Woopra to understand which platform might offer the best value for your organization.
SAS Visual Analytics: The Structured Investment

SAS Visual Analytics is part of the larger SAS suite, known for its comprehensive analytics solutions tailored to enterprise needs. Pricing for SAS products, including Visual Analytics, is typically structured but not publicly disclosed, reflecting the customizable nature of their offerings. Organizations interested in SAS Visual Analytics need to contact SAS directly to get a quote, which will be tailored to their specific requirements, including the scale of deployment, the number of users, and any additional SAS solutions being integrated.
This pricing model allows for a high degree of customization to fit each organization’s unique needs but also means that the initial investment can be significant, especially for larger implementations. The value proposition of SAS Visual Analytics lies in its deep analytical capabilities and the robust support and training services offered by SAS, making it a considerable investment for businesses that require a comprehensive, enterprise-level analytics solution.
Woopra: The Transparent Approach
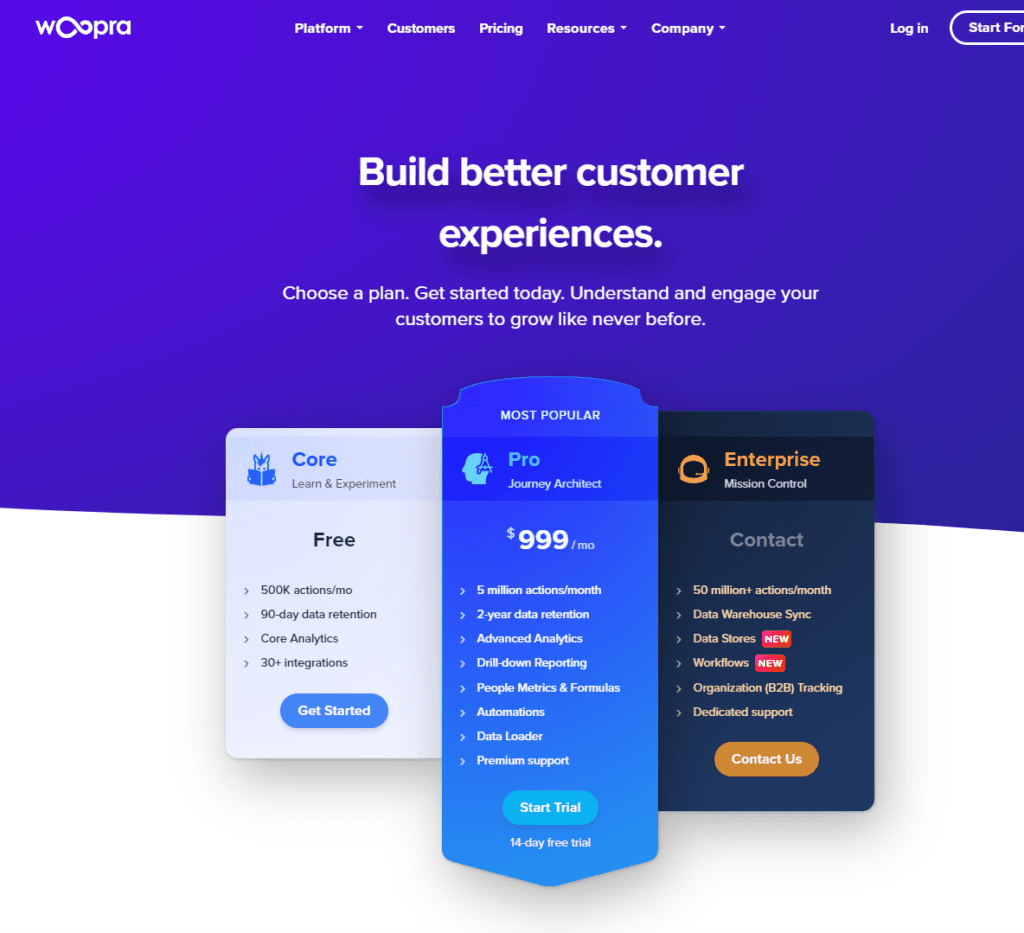
Woopra offers a more transparent and straightforward pricing model, detailed on their website, which is designed to cater to businesses of various sizes. The platform provides a free tier with basic features suitable for small projects or businesses just starting their analytics journey. For more advanced features and greater data capacities, Woopra offers several premium plans, with pricing that scales based on the number of customer profiles tracked and the level of functionality required.
This clear, tiered pricing structure makes it easier for businesses to understand their potential investment in Woopra and to scale their usage as their needs evolve. Woopra’s model is particularly appealing to small and medium-sized businesses looking for a powerful yet accessible customer analytics solution that offers predictable costs without requiring a significant upfront investment.
Area of Comparison: Data Integration Capabilities
One of the first challenges in any data analytics journey is gathering diverse data streams into a single, navigable map. The ease and extent to which an analytics tool can integrate disparate data sources significantly influences the speed and depth of the insights you can achieve. Let’s delve into how SAS Visual Analytics and Woopra fare in this crucial task.
SAS Visual Analytics: The Universal Translator
SAS Visual Analytics is like a universal translator, adept at deciphering and integrating data from a myriad of sources. With its strong heritage in statistical analysis and data processing, SAS Visual Analytics offers robust capabilities to handle, clean, and prepare data for analysis. It excels in transforming raw data from various formats and origins, including cloud sources, databases, and spreadsheets, into a coherent dataset ready for exploration.
This platform is designed for organizations with complex data ecosystems, offering advanced ETL (Extract, Transform, Load) functionalities and data management features. SAS Visual Analytics ensures that regardless of the data’s origin, it can be seamlessly integrated and analyzed, making it an invaluable tool for businesses that require comprehensive data consolidation and preparation.
Woopra: The Specialist Craft
Woopra, on the other hand, operates more like a specialist craft, designed specifically for navigating the realm of customer data. Its integration capabilities are finely tuned for capturing data across various customer touchpoints, from websites and mobile apps to emails and support interactions. Woopra offers a streamlined approach to integrating this customer-centric data, providing businesses with a real-time view of their customer journey.
While Woopra may not have the broad data integration capabilities of SAS Visual Analytics, it excels in its domain, offering businesses a focused tool for understanding and enhancing customer experiences. Its ease of integration with CRM, marketing automation, and customer service tools makes Woopra an attractive option for organizations prioritizing customer analytics.

Related: Check out our free SEO suite

Advanced Analytics and Machine Learning Capabilities: SAS Visual Analytics vs Woopra
As businesses sail further into the data-driven age, the ability to not only analyze past and present data but also to predict future trends becomes a lighthouse guiding strategic decisions. Here, we’ll compare how SAS Visual Analytics and Woopra equip organizations with the tools to navigate these forward-looking waters.
SAS Visual Analytics: The Deep Diver
SAS Visual Analytics is part of the broader SAS suite, renowned for its deep statistical analysis and advanced analytics capabilities. It offers a comprehensive set of tools for predictive modeling, forecasting, and optimization. Users can leverage SAS’s powerful analytics to uncover hidden patterns, identify trends, and make predictions based on vast datasets. This platform is like a deep-sea vessel equipped for extensive explorations beneath the surface of your data ocean.
SAS’s integration with its programming language allows for custom model development, making it an ideal choice for organizations with data science resources looking to build sophisticated predictive models. This capability ensures that businesses can not only understand what has happened but also anticipate future scenarios and plan accordingly.
Woopra: The Surface Skimmer
Woopra, with its focus on real-time customer analytics, offers a different kind of insight. While not primarily known for deep statistical analysis or custom model development, Woopra provides valuable predictive insights into customer behavior. Its analytics capabilities are designed to track, analyze, and predict customer actions across various touchpoints, offering businesses a real-time window into customer journeys.
Woopra’s strength lies in its ability to deliver actionable insights quickly, enabling marketers, product managers, and customer success teams to make informed decisions that enhance the customer experience. Though it may not dive as deep into the data as SAS, Woopra skims the surface efficiently, catching important trends and patterns related to customer engagement and behavior.
Training and Educational Resources: SAS Visual Analytics vs Woopra
The availability of learning materials, training programs, and educational support can significantly influence how quickly and effectively a team can leverage an analytics tool to drive insights and value.
SAS Visual Analytics: A Comprehensive Curriculum
SAS Visual Analytics benefits from the extensive training and educational resources that SAS Institute offers. With decades of experience in the analytics field, SAS provides a wealth of learning materials designed to help users at all levels—from beginners to advanced practitioners—master the platform. This includes a broad range of self-paced online courses covering basic introductions to advanced analytics techniques.
For those looking to validate their skills, SAS offers certification programs that are recognized across the industry. Active user communities and forums where users can share knowledge, ask questions, and learn from peers. Opportunities for live instruction and interaction with SAS experts, offering deeper dives into specific functionalities and best practices. This comprehensive approach to training and education makes SAS Visual Analytics a strong candidate for organizations that prioritize formal learning structures and have a diverse range of user expertise levels.
Woopra: Focused and Accessible Learning
Woopra, while a smaller entity compared to SAS, provides focused and accessible educational resources tailored to its platform’s specific functionalities. These resources are designed to quickly bring users up to speed on how to best use Woopra for customer analytics. Woopra’s training offerings includes detailed of how-to guides and documentation that cover the basics of setting up and using Woopra.
A blog and collection of case studies that offer insights into practical applications and best practices. Though not as frequent as SAS’s offerings, these sessions provide valuable insights into maximizing the value of Woopra. Direct support for troubleshooting and learning how to use the platform effectively. Woopra’s educational resources are particularly beneficial for teams looking for straightforward, practical guidance to quickly start leveraging the platform for customer analytics without a steep learning curve.
Conclusion
As we conclude our exploratory voyage through the capabilities, features, and financial landscapes of SAS Visual Analytics and Woopra, it’s evident that both platforms offer distinct paths for organizations embarking on data-driven journeys. Thank you for joining this detailed comparison of SAS Visual Analytics and Woopra.
As you stand at the helm, ready to steer your organization toward the treasure trove of insights hidden within your data, remember that the most effective analytics tool is the one that aligns with your journey’s unique challenges and aspirations. Whether your path aligns with the comprehensive capabilities of SAS Visual Analytics or the focused insights offered by Woopra, your voyage into data analytics is a testament to your organization’s commitment to navigating the future informed by data.
READ NEXT:
- Delivra vs EmailOctopus: The Best Email Marketing Tool for You
- QlikView vs MonsterInsights: The Best Analytics Tool for You
- SAS Visual Analytics vs Tableau: The Best Analytics Tool for You
- Vtiger vs Wise Agent: The Best CRM Tool for You
- QlikView vs Zoho Analytics: The Best Analytics Tool for You
- 11 Marketing Analytics Tools to Elevate Your Data-Driven Strategies
- 29+ Digital Analytics Software to Skyrocket Your Digital ROI


Comments are closed.