Navigating through the vast sea of data analytics tools can be a daunting adventure. On this quest, two towering lighthouses emerge to guide the way: SAS Visual Analytics and Tableau. Both are beacons of insight in the murky waters of data, yet they illuminate distinct paths for their navigators. As we embark on this journey, our goal is to unravel which tool—SAS Visual Analytics or Tableau—might be the right compass for your data-driven voyage. We’ll start by charting the waters of user experience (UX) and ease of use, crucial elements that define how smoothly you can sail towards insight discovery.
| SAS Visual Analytics | Tableau |
|---|---|
 |  |
| G2 Score -4.4 out of 5 | G2 Score -4.4 out of 5 |
| TrustRadius Score -8.4 out of 10 | TrustRadius Score -8.2 out of 10 |
User Experience and Ease of Use: Setting Sail with Clarity
The helm of any analytics tool is its user experience and ease of use. A tool that’s a breeze to navigate can make the journey to insights not just faster, but more enjoyable. Let’s see how SAS Visual Analytics and Tableau fare in making your data analytics voyage as smooth as possible.
SAS Visual Analytics: The Sturdy Galleon
SAS Visual Analytics, with its robust and comprehensive suite, is like a sturdy galleon built for deep voyages into the sea of data. It’s designed with the power to handle complex, large-scale analytics needs, offering a broad suite of tools for data exploration, reporting, and advanced analytics. The platform’s strength lies in its ability to sail through vast oceans of data, providing the depth of insight needed for complex decision-making.
However, the sophistication of SAS Visual Analytics means it can sometimes be a vessel that requires seasoned navigators. New users may find themselves taking a bit longer to get acquainted with its controls and capabilities. The trade-off here is clear: invest time in learning to navigate this powerful galleon, and you’ll be rewarded with insights as deep and vast as the ocean itself.
Tableau: The Agile Schooner
Tableau, on the other hand, is like an agile schooner, renowned for its speed and maneuverability. It stands out for its intuitive drag-and-drop interface, which makes sailing into the winds of data exploration feel effortless. Tableau is designed to make data analytics accessible to users of all skill levels, from data novices to seasoned analysts. Its ability to connect to various data sources and transform them into visually stunning dashboards and reports is where Tableau truly shines.
This tool’s focus on user experience and ease of use does not mean it sacrifices depth for simplicity. On the contrary, Tableau offers a rich set of features that allow users to dive deep into their data, all while maintaining an interface that’s as easy to navigate as the clear blue sky.
Pricing: The Compass Pointing to Value
The pricing structure of an analytics tool is like a compass, guiding businesses towards a solution that balances cost with capabilities. It’s essential for this compass to be clear and aligned with the treasure map of your business’s needs and goals. Here’s how SAS Visual Analytics and Tableau chart their courses in the realm of pricing.
SAS Visual Analytics: Navigating Through Customized Waters

SAS Visual Analytics approaches pricing like a captain charting a course through customized waters, offering tailored pricing plans based on the specific needs and scale of an organization. This model can include a combination of upfront license fees, annual subscription costs, and possibly additional charges for support, training, and cloud services, depending on the deployment option chosen.
Engaging with SAS for Visual Analytics means entering into a dialogue to customize a package that fits your organizational requirements, data complexity, and user base. While this tailored approach ensures you pay for only what you need, it requires a thorough exploration to understand the full scope of potential costs. This pricing model is reflective of SAS Visual Analytics’ positioning as an enterprise-grade solution, designed for organizations seeking a deep, comprehensive dive into analytics.
Tableau: Setting Sail with Transparent Tiers

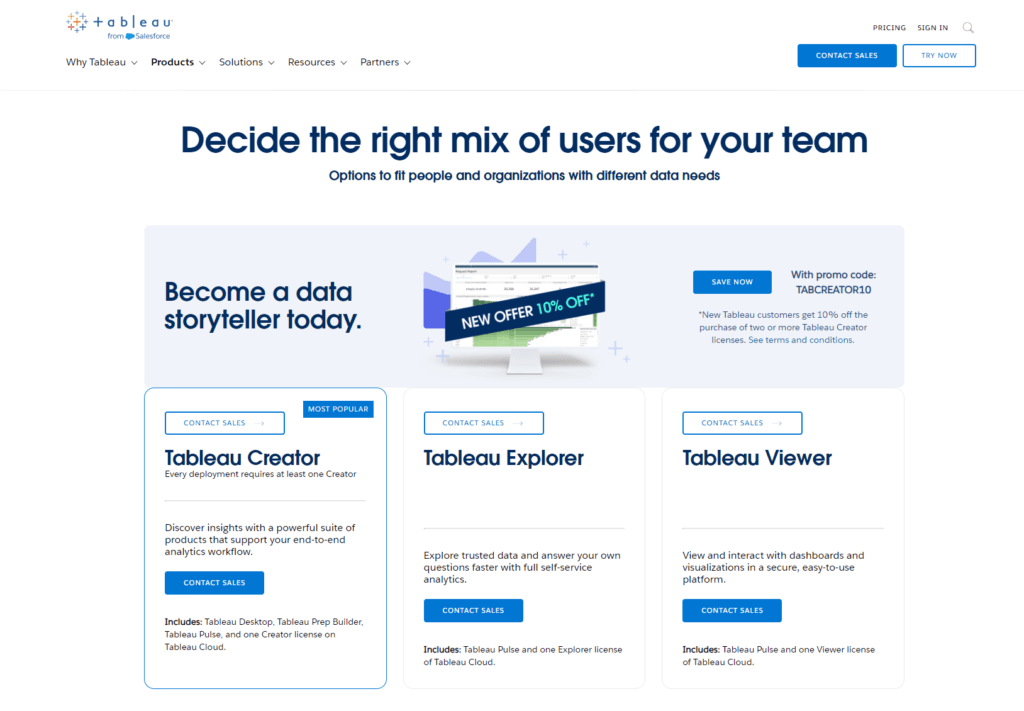
Tableau, in contrast, charts a course through clearer waters with its transparent, tiered pricing model. It provides straightforward subscription plans that cater to different types of users, from individual analysts to entire organizations. Pricing for Tableau is segmented into distinct offerings: Tableau Creator, Explorer, and Viewer, each providing varying levels of access to the tool’s capabilities, from creating and preparing data to exploring and viewing dashboards.
Tableau’s pricing structure is designed to scale with your business, offering the flexibility to add more users or upgrade plans as your analytics needs grow. This model allows businesses of all sizes to predict and control their investment in analytics, making Tableau an attractive option for those seeking both clarity in costs and the ability to scale their analytics capabilities.
Integration Capabilities: The Art of Seamlessness
The ability to integrate efficiently with a wide array of data sources, applications, and platforms can significantly enhance an analytics tool’s utility. It’s about ensuring that different data streams can be brought together effortlessly to provide a unified view of the information landscape. Here’s how SAS Visual Analytics and Tableau equip businesses to tackle these integration challenges.
SAS Visual Analytics: The Versatile Fleet
SAS Visual Analytics is akin to a versatile fleet, capable of navigating through diverse data waters with ease. It offers robust integration capabilities, designed to accommodate a wide variety of data sources, including databases, cloud storage, and third-party applications. SAS’s comprehensive approach ensures that regardless of where your data resides—be it in traditional data warehouses or scattered across cloud-based services—it can be seamlessly brought into the SAS environment for analysis.
The platform’s strength in integration lies in its ability to not only connect with these various data sources but also to preprocess and clean data as it’s ingested. This preprocessing capability is crucial for businesses dealing with large volumes of data from disparate sources, ensuring that the data is analysis-ready as soon as it’s brought on board.
Tableau: The Swift Connector
Tableau, renowned for its agility, acts as a swift connector in the realm of data integration. Its intuitive interface simplifies the process of connecting to virtually any data source, from SQL databases to cloud services like Google Analytics and Salesforce. Tableau’s focus on user experience extends to its integration capabilities, making it straightforward for users to bring together diverse data sets for visualization and analysis.
What sets Tableau apart is its flexibility in handling live data connections as well as in-memory data extracts, allowing users to choose the best approach based on their specific needs and the freshness of data required. This flexibility, combined with Tableau’s powerful data blending features, enables businesses to create comprehensive dashboards that offer insights from across their entire data ecosystem.

Related: Check out our free SEO suite

Scalability: Navigating Growth
Scalability in analytics tools is about more than just handling larger data volumes; it’s about maintaining performance, providing consistent insights, and accommodating an increasing number of users as a business grows. Here’s how SAS Visual Analytics and Tableau are built to navigate these challenges.
SAS Visual Analytics: The Expansive Vessel
SAS Visual Analytics is like an expansive vessel, designed to accommodate growth both in size and complexity. With its robust server-based architecture, SAS Visual Analytics is well-suited for large enterprises that anticipate significant growth in data volume and user base. It offers the horsepower needed to process and analyze large datasets efficiently, ensuring that insights are delivered promptly, regardless of the scale.
One of the key strengths of SAS Visual Analytics in terms of scalability is its distributed in-memory processing, which allows for the parallel processing of data across multiple servers. This not only enhances performance but also ensures that the system can scale up to meet increasing demands. Additionally, SAS’s architecture supports cloud deployments, providing flexibility for businesses looking to scale their analytics operations without the constraints of physical infrastructure.
Tableau: The Agile Clipper
Tableau, on the other hand, is like an agile clipper, renowned for its speed and flexibility. It offers scalability that is particularly appealing to medium-sized businesses and enterprises poised for growth. Tableau’s scalability is anchored in its dual approach to data handling: live connections that offer real-time insights and in-memory extracts that optimize performance.
Tableau’s scalability extends to its deployment options, which include both on-premises and cloud-based solutions, allowing businesses to choose the model that best fits their growth strategy. Furthermore, Tableau Server and Tableau Online ensure that as the number of users grows, businesses can continue to provide access to powerful analytics without degradation in performance. This flexibility makes Tableau a strong contender for organizations that need a scalable analytics solution that can quickly adapt to changing business needs.
Customer Support and Community Engagement: Your Guiding Stars
The level of customer support and the vibrancy of the user community surrounding an analytics tool can significantly impact your ability to leverage it effectively. It’s about having a lifeline in times of need and a crew of fellow navigators with whom to share maps and strategies. Here’s how SAS Visual Analytics and Tableau fare in these essential aspects.
SAS Visual Analytics: The Steady Lighthouse
SAS Visual Analytics benefits from SAS’s long-standing reputation and established presence in the analytics realm, acting as a steady lighthouse offering guidance through thick and fog. SAS provides comprehensive customer support through various channels, including direct support from their team of experts, extensive documentation, and a wealth of online resources for troubleshooting and learning.
Moreover, the SAS community is a deep ocean of knowledge, comprising long-time SAS users, experts, and analysts. Engaging with this community through forums, SAS conferences, and user groups can provide invaluable insights, tips, and best practices for maximizing the value of SAS Visual Analytics in your organization.
Tableau: The Beacon of Collaboration
Tableau shines as a beacon of collaboration, known for its vibrant and engaged user community. Tableau’s approach to customer support and community engagement is centered around collaboration and shared learning. The Tableau Community Forums are a bustling marketplace of ideas, where users from around the globe connect to share knowledge, solve problems, and exchange visualization tips.
In addition to its online forums, Tableau further nurtures its community through Tableau Public, where users can publish and share their visualizations with the world, and through local user groups and the annual Tableau Conference, which gathers data enthusiasts from all corners to learn, connect, and celebrate their achievements in analytics.
Conclusion
As we adjust our compass and prepare to dock at the conclusion of our exploratory voyage comparing SAS Visual Analytics and Tableau, we’ve traversed through critical territories that shape the decision-making landscape for businesses embarking on a data analytics journey. From the ease of use and integration capabilities to pricing models, and the invaluable realms of customer support and community engagement, both SAS Visual Analytics and Tableau have shown their unique strengths and capabilities, lighting up different paths on the analytics map.
READ NEXT:
- Segment vs Woopra: The Best Analytics Tool for You
- SAS Visual Analytics vs Statcounter: The Best Analytics Tool for You
- QlikView vs Heap: The Best Analytics Tool for You
- QlikView vs Mixpanel: The Best Analytics Tool for You
- Bitrix24 vs Vtiger: The Best CRM Tool for You
- 11 Marketing Analytics Tools to Elevate Your Data-Driven Strategies
- 29+ Digital Analytics Software to Skyrocket Your Digital ROI


