WinSavvy Editorial Standards
How this article was created
Hey there, savvy explorer of the digital realm! Are you on a quest to uncover the analytics tool that will not just meet but exceed your expectations? Look no further! Today, we’re diving into an epic showdown between two giants in the analytics world: Mouseflow and Looker. Whether you’re a business owner, a marketer, or just someone who loves to geek out on data, you’re in the right place. We’re about to embark on a journey to dissect, compare, and ultimately help you decide which tool is the secret sauce to your online success. So, buckle up, grab your favorite snack, and let’s get started on unraveling this digital puzzle together!
| Mouseflow | Looker |
|---|---|
 | |
| G2 Score -4.6 out of 5 | G2 Score -4.4 out of 5 |
| TrustRadius Score -9.9 out of 10 | TrustRadius Score -8.0 out of 10 |
Ease of Use and Learning Curve
When adopting a new tool, especially one as pivotal as an analytics platform, the ease of use and the learning curve are crucial factors that can influence your team’s adoption rate and overall efficiency. Let’s compare how Mouseflow and Looker stack up in these aspects.
Mouseflow: User-Friendly from the Get-Go
Mouseflow prides itself on being immediately intuitive. Aimed at website owners, digital marketers, and UX designers, it ensures that its interface is as straightforward as possible. This means you can jump right in and start gathering insights without needing a tutorial to navigate through the basics. Setting up heatmaps, launching session recordings, and analyzing funnels can be done with just a few clicks, making it accessible even to those with minimal analytics background.
The simplicity, however, does not detract from Mouseflow’s capability. It strikes a balance between offering powerful analytics insights and maintaining a user interface that doesn’t intimidate. This approach encourages exploration and experimentation, allowing users to learn advanced features at their own pace without feeling overwhelmed.
Looker: A Steeper Path to Mastery
Looker, with its vast capabilities extending beyond website analytics into business intelligence, naturally comes with a steeper learning curve. It’s a platform designed for data analysts, business intelligence professionals, and companies serious about embedding data into every decision-making process. Looker’s power lies in its customization capabilities, extensive data modeling, and deep integration with databases, requiring a solid understanding of data analytics principles and, in many cases, knowledge of SQL and LookML (Looker’s modeling language).
That said, Looker offers comprehensive support and training resources, including documentation, forums, webinars, and an academy with courses to help users climb the learning curve. For organizations willing to invest the time and resources, Looker becomes an invaluable tool that offers insights far beyond website interaction, encompassing sales, marketing, customer service, and operational efficiency.
Pricing: Balancing Cost and Value
When it comes down to choosing the right analytics tool for your business, understanding the pricing structure and how it correlates with the value provided is paramount. Let’s peel back the layers of Mouseflow and Looker’s pricing to see which tool offers the best bang for your buck, considering their features and capabilities.
Mouseflow: Flexibility for Every Budget
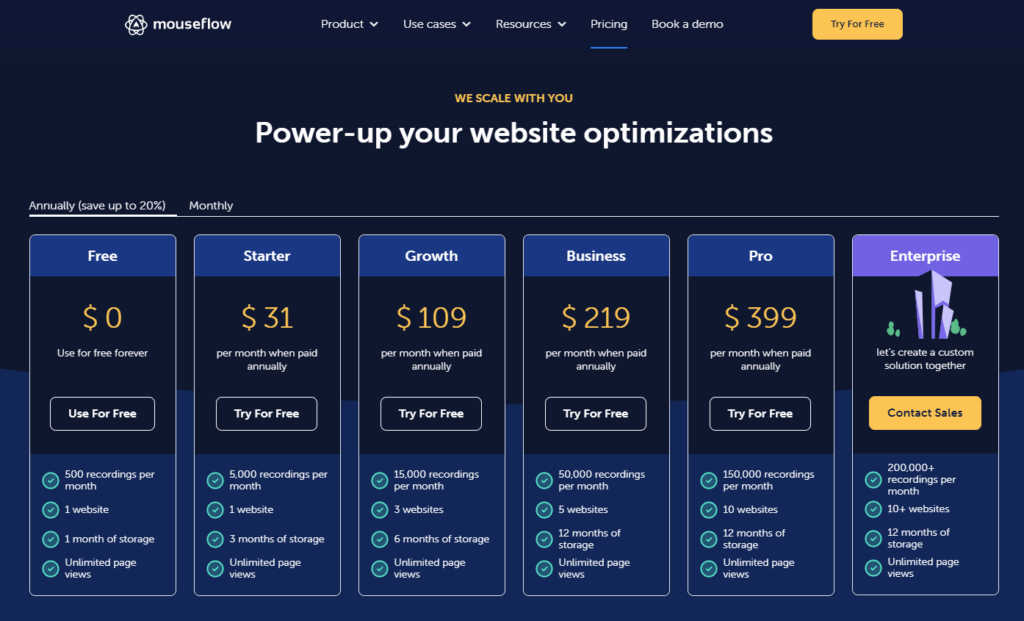
Mouseflow employs a tiered pricing strategy designed to accommodate businesses of varying sizes and needs. Starting with a free plan for very small sites or beginners wanting to dip their toes into the analytics waters, it offers basic features with limited data collection capabilities. This plan is a great way to test the waters without any financial commitment.
As you ascend the tiers, each plan increases in price but also in the value it delivers, including more data points, sessions, and access to more sophisticated features such as advanced segmentation, funnel analysis, and full API access. The pricing structure is transparent, allowing businesses to select a plan that matches their needs closely without paying for unnecessary extras.
Mouseflow’s approach to pricing is particularly appealing to small and medium-sized businesses or those at the early stages of integrating analytics into their operations. The scalability of the plans ensures that as your business grows and your data needs become more complex, Mouseflow can grow with you, providing more comprehensive tools without a steep jump in cost.
Looker: Custom Pricing for Custom Needs
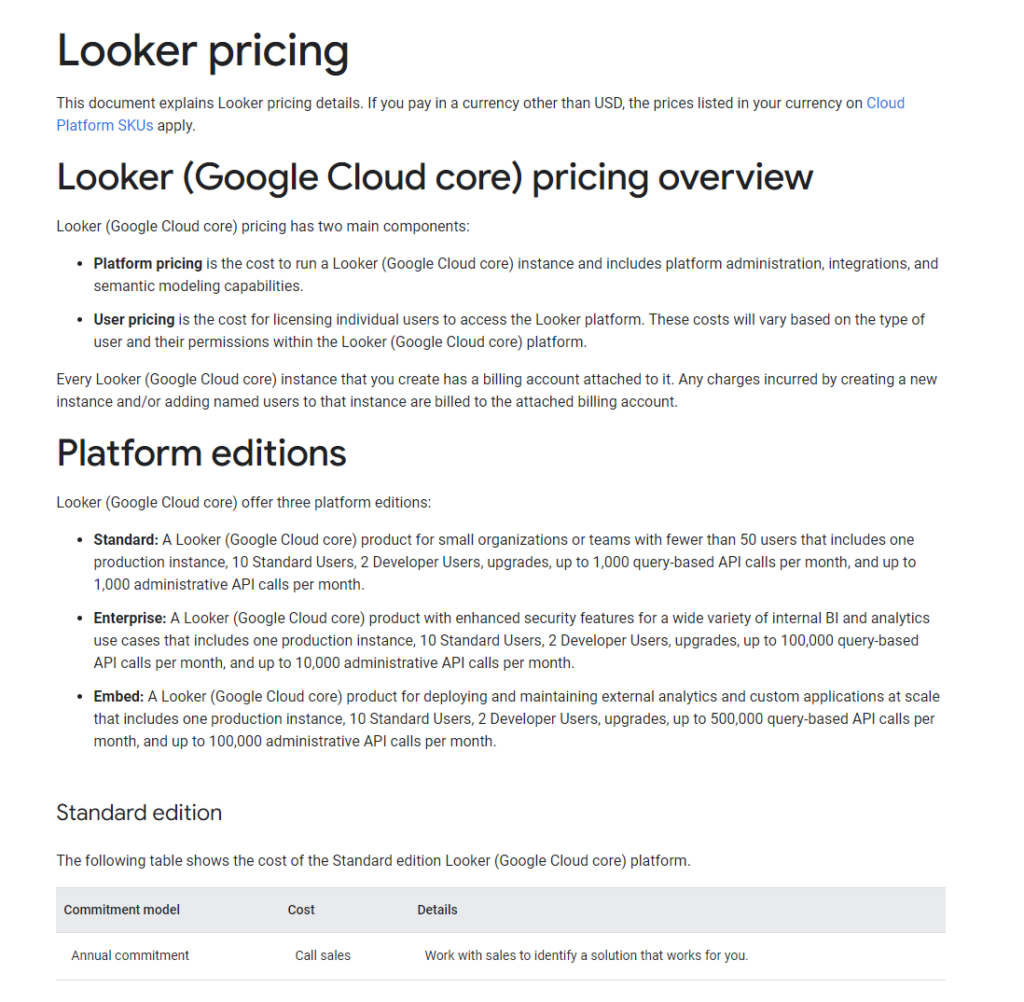
Looker takes a different approach to pricing, reflecting its position as a comprehensive business intelligence and big data analytics platform. Instead of offering fixed-price tiers, Looker provides custom pricing based on the specific needs and scale of each business. This includes factors like the number of users, the volume of data processed, and the level of customer support required.
The custom pricing model ensures that businesses only pay for what they need, but it also means that getting a clear sense of cost upfront can be challenging without engaging in a detailed consultation with Looker’s sales team. For larger organizations or those with complex data analytics needs, this approach makes sense, allowing for a tailored solution that maximizes value.
However, this model might be a barrier for smaller businesses or startups that are just beginning to explore the depths of data analytics and need a clear, straightforward understanding of costs.
Data Visualization and Reporting Capabilities
In the vast sea of analytics, the ability to not only gather data but also present it in a clear, understandable, and actionable manner is akin to finding a lighthouse in the dark. Let’s see how Mouseflow and Looker fare when it comes to lighting the way with their data visualization and reporting capabilities.
Mouseflow: A Picture Worth a Thousand Clicks
Mouseflow steps into the ring with a strong focus on visualizing user behavior on your website. Imagine being able to see through the eyes of your visitors, understanding every scroll, click, and hesitation. Mouseflow makes this possible with its heatmaps, session replay, and funnels, turning abstract data into visual stories that are easy to interpret and act upon.
Heatmaps in Mouseflow aren’t just colorful overlays; they are a window into the soul of your website, showing you exactly what elements are winning your audience’s heart and which ones are causing them to bounce. Combine this with session replays, and you’ve got yourself a detective kit to solve any user experience mystery.
However, when it comes to traditional reporting and crunching complex data sets, Mouseflow keeps it simple. It’s more about giving you actionable insights on website interaction than overwhelming you with numbers. This approach is perfect for those looking to improve user experience and conversion rates without getting lost in the data woods.
Looker: The Data Maestro
Enter Looker, a tool that approaches analytics with the precision of a maestro conducting an orchestra. Looker takes data visualization and reporting to another level, offering a platform that’s all about empowering businesses to make data-driven decisions across all departments.
With Looker, the emphasis is on customizable dashboards and reports that can get as detailed as you need. Whether you’re analyzing marketing campaigns, sales performance, customer behavior, or operational efficiency, Looker provides the tools to tailor your analytics journey. Its powerful data modeling language, LookML, allows you to define data relationships and create complex calculations, ensuring that the reports you generate are both comprehensive and highly relevant to your business needs.
The beauty of Looker lies in its ability to serve up data in a digestible format, no matter how complex the underlying datasets might be. It’s like having a personal data chef that knows exactly how to prepare your data feast, making it palatable for everyone from data scientists to marketing managers.

Related: Check out our free SEO suite

Integration and Ecosystem Compatibility
In today’s digital landscape, the best analytics tool isn’t just about standalone prowess; it’s also about how well it plays with other technologies you rely on. A tool’s ability to integrate seamlessly with your existing tech stack can significantly amplify its value. Let’s take a closer look at how Mouseflow and Looker fare in terms of integration capabilities and ecosystem compatibility.
Mouseflow: Seamlessly Blending with Your Tech Stack
Mouseflow shines in its straightforward integration with a wide range of platforms and technologies. Whether you’re running an eCommerce site on Shopify, a CMS on WordPress, or custom-built websites, integrating Mouseflow is as simple as inserting a piece of code. This simplicity ensures that you can start collecting data almost immediately, without the need for extensive IT support.
Beyond basic website integration, Mouseflow also offers connections with several third-party tools and services, enhancing its utility. For instance, its ability to integrate with e-commerce platforms, email marketing services, and CRM systems means you can enrich your customer data with insights from your website’s user behavior. These integrations are designed to be user-friendly, ensuring that even those without deep technical expertise can set them up.
Looker: A Data Hub Connecting Multiple Sources
Looker takes a different approach, focusing on being the central hub for all your data analysis needs. Its power lies in its ability to integrate with virtually any SQL database or data warehouse, from Google BigQuery and Amazon Redshift to Snowflake and more. This capability allows Looker to pull in data from across your organization, providing a unified view of your operations, marketing efforts, sales performance, and customer interactions.
Beyond its core data connections, Looker supports a robust ecosystem of integrations through its Looker Blocks and Marketplace. These include pre-built models and visualizations for specific applications and third-party tools, ranging from marketing analytics platforms to financial reporting tools. Looker’s API further extends its integration capabilities, enabling custom connections and allowing businesses to embed Looker analytics directly into their applications, websites, and products.
Wrapping up
In wrapping up our exploration of Mouseflow and Looker as analytics tools, we’ve journeyed through their strengths in data visualization and reporting, ease of use and learning curve, integration capabilities, and pricing structures. Each platform offers unique advantages tailored to different needs, making the decision a matter of aligning with your business goals, technical capabilities, and budget.
READ NEXT:
- Mouseflow vs Optimizely: The Best Analytics Tool for You
- Mouseflow vs HubSpot Marketing Analytics: The Best Analytics Tool for You
- Mouseflow vs Oracle Analytics Cloud: The Best Analytics Tool for You
- Hotjar vs SAS Visual Analytics: The Best Analytics Tool for You
- Legal Troubles for Platform Business Models
- 11 Marketing Analytics Tools to Elevate Your Data-Driven Strategies
- 29+ Digital Analytics Software to Skyrocket Your Digital ROI


Comments are closed.