WinSavvy Editorial Standards
How this article was created
In today’s digital landscape, where data is as vital as currency, selecting the right analytics tool can be the linchpin for success. Enter GoSquared and SAS Visual Analytics, two platforms at the forefront of the analytics revolution, but catering to distinctly different needs. GoSquared shines with its real-time analytics, offering SMEs and startups the agility to make quick decisions. SAS Visual Analytics, however, provides comprehensive data exploration capabilities suitable for enterprises looking to delve deep into their data for strategic insights. If you’re at the crossroads, trying to decide which path to take—immediate insights or in-depth analysis—this comparison aims to shed light on the best analytics tool for you, starting with their approach to data visualization.
| GoSquared | SAS Visual Analytics |
|---|---|
 |  |
| G2 Score -4.6 out of 5 | G2 Score -4.4 out of 5 |
| TrustRadius Score -9.0 out of 10 | TrustRadius Score -8.4 out of 10 |
Data Visualization: Painting the Picture of Your Data
The way an analytics tool visualizes data can significantly impact the insights you derive and the actions you take. Let’s explore how GoSquared and SAS Visual Analytics approach data visualization.
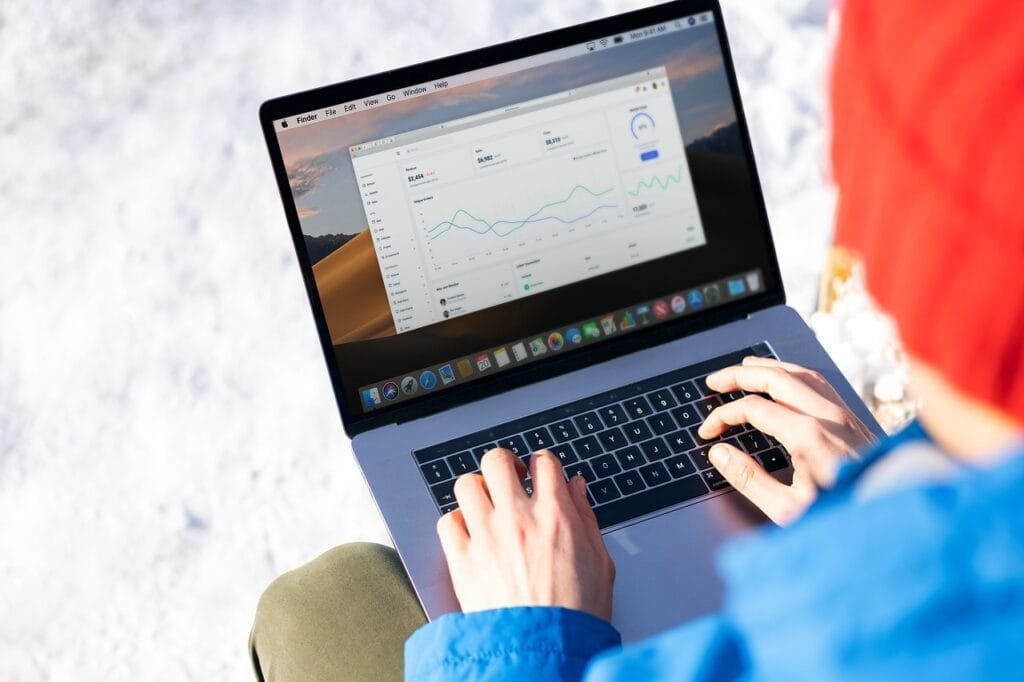
GoSquared: Real-Time Data for Agile Decision-Making
GoSquared’s strength lies in its ability to visualize real-time data, making it an indispensable tool for businesses that need to act fast. Its dashboard is designed for simplicity, presenting key metrics in an intuitive format that allows for immediate interpretation and action. This real-time visualization capability ensures that SMEs and startups can monitor their website’s performance, user engagement, and campaign results as they happen, enabling quick adjustments to capitalize on opportunities or mitigate issues.
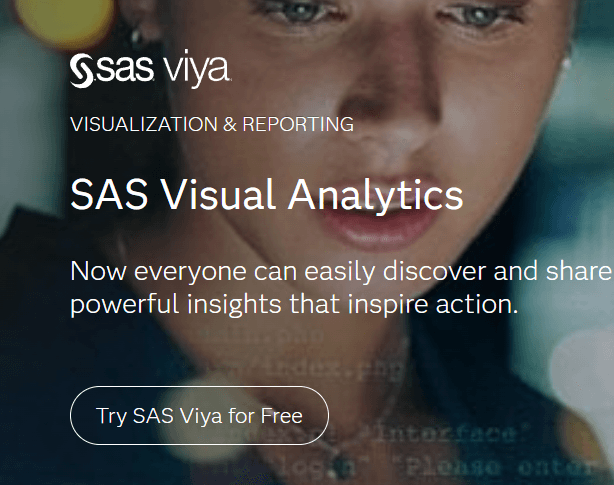
SAS Visual Analytics: Comprehensive Insights for Strategic Planning
SAS Visual Analytics offers a robust suite of visualization tools designed to unearth deep insights from complex datasets. It provides a wide range of chart types, interactive reports, and dashboards that can handle large volumes of data, allowing businesses to explore every facet of their information.
With SAS Visual Analytics, enterprises can not only see what’s happening in their operations but also understand why it’s happening, thanks to advanced analytics features like forecasting, correlation analysis, and scenario planning. This depth of visualization supports strategic decision-making, helping businesses to plan their next moves based on comprehensive data analysis.
Pricing Structure and Return on Investment: Balancing Cost with Benefits
A clear understanding of the pricing model and the potential ROI from utilizing the analytics platform is crucial for businesses to ensure they’re making a sound investment.
GoSquared: Transparent Pricing for SMEs and Startups
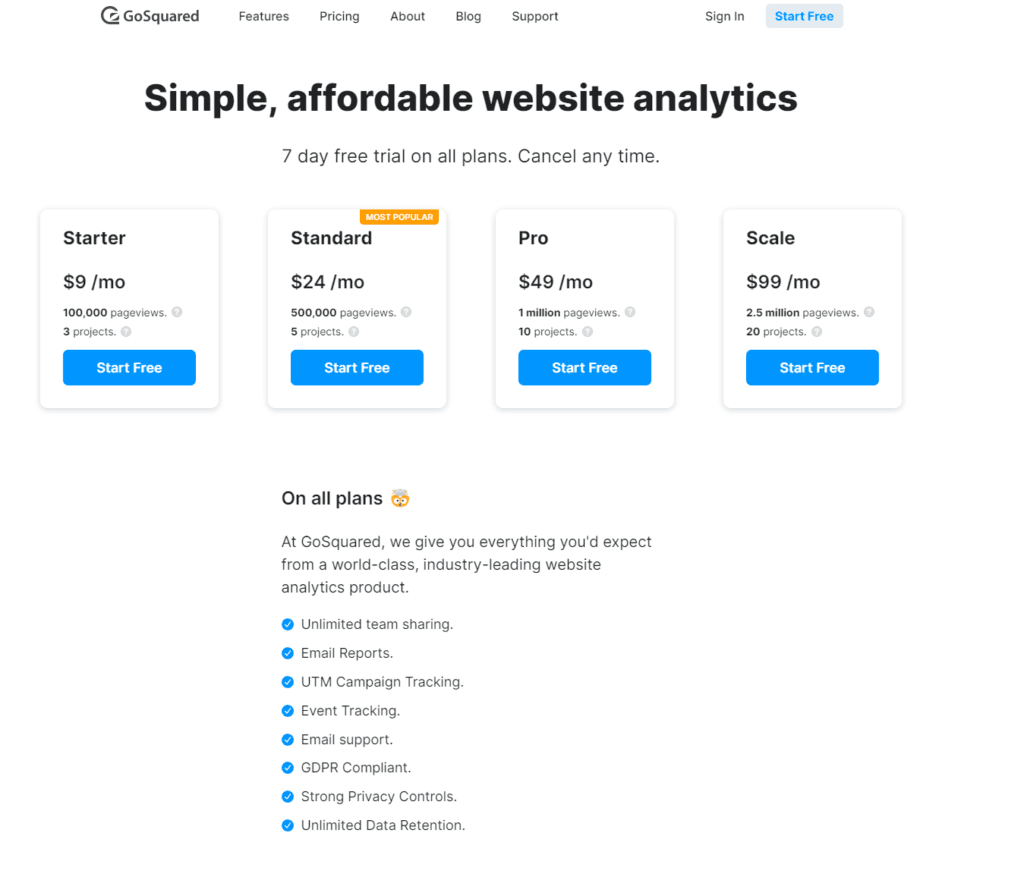
GoSquared’s pricing model is designed with transparency and scalability in mind, aiming to cater to the financial constraints and growth trajectories of SMEs and startups. It typically offers several tiered plans, ranging from a basic, cost-effective option for smaller businesses just starting their analytics journey to more advanced packages that include additional features and capabilities for growing companies.
The straightforward nature of GoSquared’s pricing allows businesses to predict their expenses and scale their usage as their needs evolve, ensuring they can always align the cost with the value received. For businesses looking for a no-frills, efficient analytics tool that offers immediate insights, GoSquared represents a promising ROI by enhancing user engagement and conversion rates without a hefty investment.
SAS Visual Analytics: Custom Pricing for Comprehensive Enterprise Solutions
In contrast, SAS Visual Analytics adopts a custom pricing model that reflects its comprehensive suite of BI and analytics features. Tailored to meet the complex needs of larger enterprises, the cost of SAS Visual Analytics is determined by factors such as the scale of deployment, the number of users, and the specific features required.
This bespoke approach ensures that enterprises can configure the platform to match their extensive analytics needs precisely, albeit at a higher cost. The investment in SAS Visual Analytics is justified by the depth and breadth of insights it provides, enabling significant improvements in strategic decision-making, operational efficiency, and competitive advantage across various departments and functions.
Integration Capabilities: Streamlining Your Data Ecosystem
The ability to integrate effectively can make or break the utility of an analytics solution, impacting how well it complements your current tech stack and business processes.
GoSquared: Agile Integration for Real-Time Action
GoSquared focuses on agility and ease of use, which extends to its integration capabilities. It offers straightforward integrations with popular CRM software, marketing platforms, and other tools commonly used by SMEs and startups. This ensures businesses can quickly connect GoSquared with their existing systems, enabling real-time data collection and analysis without significant IT overhead. Particularly for businesses with lean operations, GoSquared’s integration approach allows for rapid deployment and immediate value from analytics insights, making it a strong candidate for those looking to enhance their data-driven decision-making quickly.
GoSquared’s appeal lies in its nimbleness, particularly attractive to SMEs and startups that operate in fast-paced environments. A deeper look into its integration capabilities reveals a strategy focused on enhancing the agility of a business’s tech stack. Beyond mainstream CRM and marketing platforms, GoSquared offers plug-and-play integrations with e-commerce systems, customer support tools, and project management apps. This diversity supports a seamless workflow across different departments, from sales to customer service, ensuring that every team has access to real-time data.
GoSquared’s API extends beyond custom integrations, allowing businesses to develop unique applications or features specific to their operational needs. This flexibility is crucial for businesses looking to innovate and differentiate themselves in crowded markets. GoSquared enables businesses to automate routine tasks by integrating with automation tools. For instance, tagging users based on behavior automatically updates CRM records, streamlines email marketing campaigns, or triggers personalized communications, enhancing efficiency and personalization.
SAS Visual Analytics: Comprehensive Integration for In-depth Analysis
SAS Visual Analytics provides a robust framework for integration, designed to meet the complex needs of larger enterprises. It can connect with a wide variety of data sources, including cloud-based services, on-premise databases, and big data frameworks. This broad integration capability is crucial for businesses that rely on diverse data streams to inform their strategy and operations.
SAS Visual Analytics is designed for depth and breadth, making it a cornerstone for enterprises that rely on comprehensive data strategies. SAS Visual Analytics excels in integrating with a wide range of data sources, including IoT devices, social media streams, and even unstructured data like text and images. This capability ensures enterprises can harness all relevant data, providing a holistic view of their operations and market environment.
With its comprehensive integration capabilities, SAS Visual Analytics also emphasizes advanced data governance features. These ensure that as data moves across systems, it remains secure, compliant, and within the defined usage policies, addressing the complex regulatory landscapes that large enterprises navigate.
Customer Support and Service: Ensuring Smooth Analytics Operations
The responsiveness, availability, and expertise of a platform’s customer support team can significantly impact user satisfaction and operational efficiency.
GoSquared: Responsive Support Tailored to SME Needs
GoSquared prides itself on offering responsive and accessible customer support, understanding that SMEs and startups often lack the time and technical resources to deal with complex troubleshooting. Support is provided through various channels, including live chat, email, and an extensive knowledge base filled with helpful guides and FAQs.
This approach ensures that users can quickly find answers to their questions or issues, minimizing any disruption to their analytics activities. GoSquared’s commitment to customer support is a testament to its focus on user satisfaction and operational agility.
SAS Visual Analytics: Comprehensive Support for Enterprise Users
SAS Visual Analytics, catering to the comprehensive needs of larger enterprises, offers a broad spectrum of support services designed to address the complex issues that can arise within extensive data environments. In addition to traditional support channels, SAS provides dedicated account managers, technical support teams, and user communities where professionals can share insights and solutions.
The depth of support reflects SAS Visual Analytics’ commitment to ensuring enterprises can fully leverage its powerful analytics capabilities, with the reassurance that expert help is available whenever needed.

Related: Check out our free SEO suite

Learning Resources and Community Support: Empowering Users for Mastery
The journey to becoming proficient in an analytics tool and leveraging it for maximum impact is greatly influenced by the learning resources and community support available.
GoSquared: Streamlined Learning for Quick Mastery
GoSquared aims to make its platform as intuitive and user-friendly as possible, which is reflected in its approach to learning resources. It provides a concise, well-curated selection of guides, tutorials, and blog posts designed to get users up and running quickly. These resources focus on practical applications of GoSquared’s features, helping users to rapidly understand how to apply the tool’s capabilities to their specific business contexts.
While GoSquared’s community might be smaller than that of a giant like SAS, it offers direct access to customer support, ensuring users can receive personalized help when needed. This streamlined approach to learning and support is especially beneficial for SMEs and startups that need to move fast and cannot afford lengthy learning curves.
SAS Visual Analytics: Comprehensive Resources for In-depth Learning
SAS Visual Analytics, on the other hand, offers an extensive array of learning resources, including detailed documentation, video tutorials, and user forums. These materials cover everything from basic functionalities to advanced analytics techniques, catering to a wide range of users from beginners to data scientists. SAS also boasts a large, active user community and regularly hosts events and webinars, providing valuable opportunities for learning and networking.
This comprehensive support ecosystem enables users to deeply explore the platform’s capabilities and continuously expand their analytics skills. For enterprises with the resources to invest in in-depth learning, SAS Visual Analytics’ rich educational offerings can facilitate a high level of proficiency across the team.
Conclusion
In wrapping up our exploration into the analytics landscape, particularly through the lens of GoSquared and SAS Visual Analytics, and extending into broader themes like mobility, it’s evident that the choice of an analytics tool is deeply influenced by a confluence of factors tailored to each business’s unique needs, operational dynamics, and future vision.
READ NEXT:
- Emma Email Marketing Tool vs Elastic Email: The Best Email Marketing Tool for You
- Clicky vs MonsterInsights: The Best Analytics Tool for You
- Insightly vs Salesmate: The Best CRM Tool for You
- “GoSquared vs QlikView: The Best Analytics Tool for You”
- Pipedrive vs Salesmate: The Best CRM Tool for You
- 11 Marketing Analytics Tools to Elevate Your Data-Driven Strategies
- 29+ Digital Analytics Software to Skyrocket Your Digital ROI


Comments are closed.