WinSavvy Editorial Standards
How this article was created
Navigating the maze of analytics tools available today can be as tricky as choosing the right path in a dense, uncharted forest. With each tool promising to guide you to the treasure trove of insights, it’s easy to feel lost. Today, we’re shining a lantern on two prominent paths: QlikView and Amplitude. Both tools are powerhouses in their own right, designed to arm businesses with the data insights they need to make informed decisions. But the question stands – which is the right guide for you? Let’s embark on this journey together, starting with a dive into their approaches to data analysis and visualization.
| QlikView | Amplitude |
|---|---|
 | |
| G2 Score -4.1 out of 5 | G2 Score -4.2 out of 5 |
| TrustRadius Score -8.0 out of 10 | TrustRadius Score -8.2 out of 10 |
Data Analysis and Visualization: The Heart of Your Journey
In the realm of data analytics, the ability to not just see the data but to understand and interact with it is crucial. It’s the difference between having a static map and a dynamic, interactive guide. Here’s how QlikView and Amplitude chart the course.
QlikView: The Detailed Mapmaker
QlikView is like a master cartographer, offering a tool that allows businesses to create detailed, interactive maps of their data. It’s renowned for its powerful, in-memory data processing, which means it can handle complex data models and large volumes of data with speed. With QlikView, you’re not just observing your data; you’re engaging with it, discovering hidden pathways and connections that can lead to valuable insights.
The platform stands out for its highly customizable data visualization capabilities. You can tailor every aspect of your data’s appearance, from charts and graphs to fully interactive dashboards. This level of customization requires a certain degree of skill and understanding of the tool, making QlikView more suited to those with a technical background or businesses that have data analysts in their ranks.
However, this power and depth come with a complexity that can be daunting for beginners. Imagine being handed a map in a foreign language; that’s how newcomers might feel when first navigating QlikView. But for those willing to learn its language, QlikView offers a detailed, comprehensive view of the business landscape that is hard to beat.
Amplitude: The Intuitive Explorer
Amplitude, on the other hand, is like an intuitive, agile explorer. It’s designed with a focus on user behavior analytics, making it a powerful tool for businesses that want to understand how users interact with their digital products. Amplitude excels in tracking user journeys, analyzing funnels, and understanding the impact of specific features or changes on user engagement and retention.
What sets Amplitude apart is its user-friendly interface and visualization tools. It’s built to be accessible to users regardless of their technical expertise, offering a more straightforward path to insights. You can easily create beautiful, insightful visualizations without needing to dive deep into custom scripting or data processing. This accessibility makes Amplitude particularly appealing to product managers, marketers, and other non-technical stakeholders who need to make data-driven decisions quickly.
While Amplitude offers robust capabilities for analyzing user data, its focus is narrower than QlikView’s. It’s like comparing a detailed country map to a city street map; both are incredibly valuable, but they serve different purposes. Amplitude is tailored for businesses that are primarily focused on optimizing digital products and understanding user behavior, rather than deep-diving into complex data from multiple sources.
Pricing: Mapping Out Your Investment
Understanding how much you’ll invest in these tools is crucial, as it’s about balancing the cost with the value they bring to your treasure hunt for insights. Let’s break down the pricing models of QlikView and Amplitude to see which might best suit your budget and needs.
QlikView: The Tailored Expedition
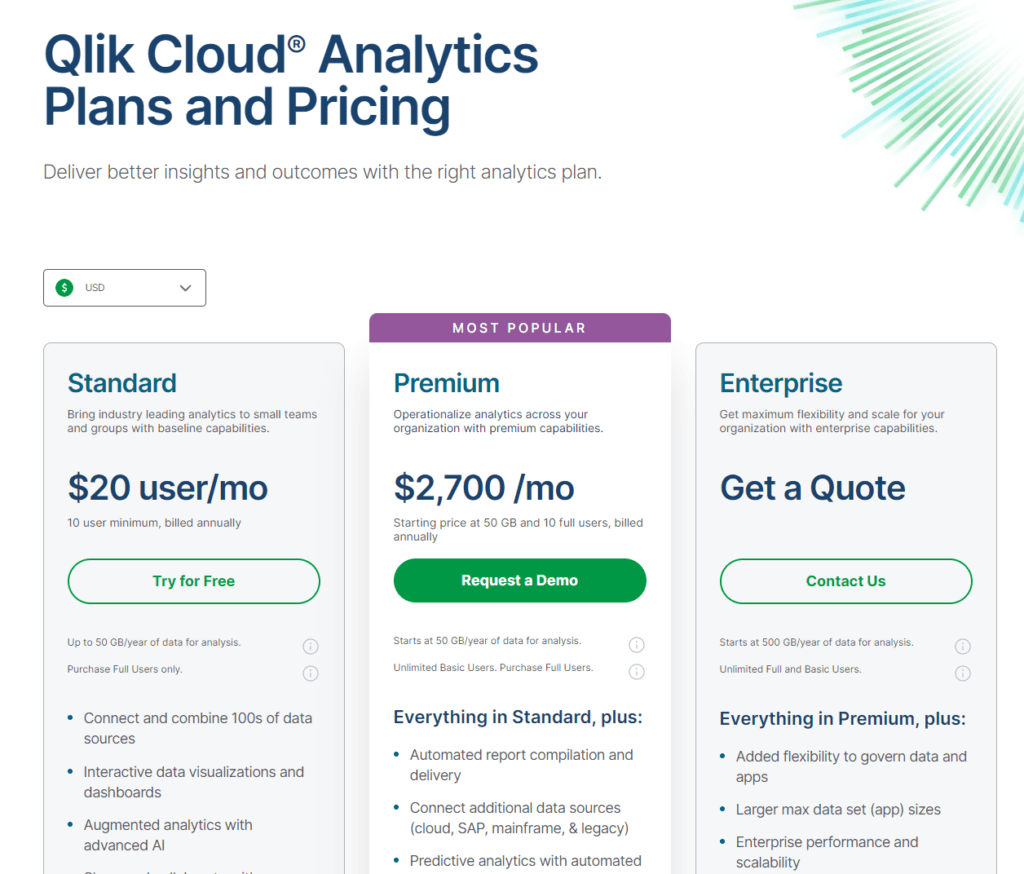
QlikView’s pricing structure is akin to planning a tailored expedition; it’s customized based on your specific requirements and the scale of your adventure. This means that the cost can vary significantly depending on several factors, including the number of users, the server requirements, and the level of customization and support you need.
QlikView operates on a license-based model, where you purchase licenses upfront, with the price adjusted according to the size of your team and the deployment scale. Additionally, there are ongoing maintenance fees to consider, which cover support and software updates. This model can be advantageous for large organizations looking for a powerful, customized solution and willing to invest in a tool that precisely fits their needs. However, for smaller businesses or startups, the upfront cost and the complexity of determining the exact pricing can be daunting.
Amplitude: The Scalable Journey
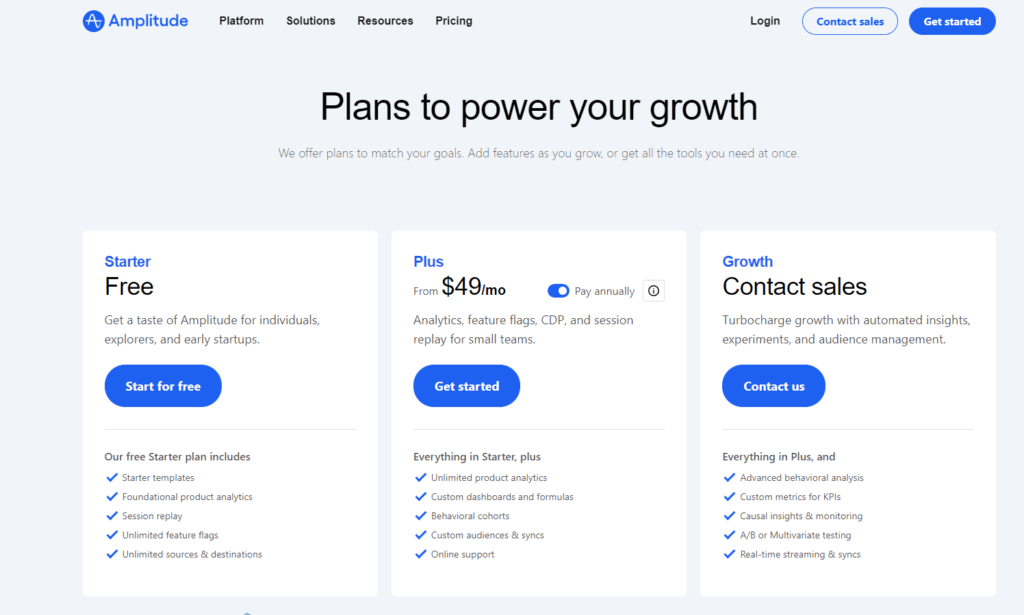
Amplitude’s pricing structure is more like choosing a journey based on well-defined paths, with clarity on the costs and what each path offers. It provides a tiered pricing model, which ranges from a free basic plan suited for smaller teams looking to get started with product analytics, to more advanced plans that cater to businesses with greater needs in terms of data volumes and analysis capabilities.
The free tier offers access to core analytics features, making it an attractive option for startups or companies with limited budgets. As your needs grow, you can move up to more comprehensive plans, which are priced based on the volume of data tracked and the number of seats required. This scalability ensures that you can start small and increase your investment as your business and data needs grow, without a significant upfront cost.
Amplitude’s transparent pricing model makes it easier for businesses to understand what they’re getting and to forecast their expenses as they scale. This can be particularly appealing for businesses with variable data needs or those looking to control costs while still gaining valuable insights into user behavior.
Integration Capabilities and Scalability: Expanding Your Map
The true value of an analytics tool is not just in how it handles the data today but in its ability to adapt to tomorrow’s data challenges. Here’s how QlikView and Amplitude stack up in these areas.
QlikView: The Versatile Cartographer
QlikView’s architecture is designed for versatility and scalability. It can integrate with a wide array of data sources, including ERP systems, databases, spreadsheets, and even big data. This makes it an excellent tool for organizations that rely on diverse data streams and require a unified analytics platform to bring all their data together.
Its in-memory processing ensures that as your data grows, QlikView can scale to meet your needs, handling complex data models and large datasets without significant performance hits. This scalability is crucial for businesses that are expanding or those whose data needs are becoming increasingly sophisticated.
Moreover, QlikView’s open API allows for extensive customization and integration with other tools and systems, ensuring that it can adapt to your business’s evolving ecosystem. However, leveraging these capabilities to their fullest extent often requires a dedicated IT team or data professionals skilled in data integration and manipulation.
Amplitude: The Agile Explorer
Amplitude is built with digital product analytics at its core, focusing on seamless integration with digital products and services. It offers robust SDKs for web and mobile platforms, making it easy to track user behavior right out of the box. Its integration capabilities extend to common marketing and product tools, enabling businesses to connect Amplitude with their existing tech stack to create a cohesive data ecosystem.
While Amplitude might not boast the same level of data source integration versatility as QlikView, it excels in its domain, providing deep insights into user interactions and behaviors. Its scalability is evident in its ability to handle billions of user actions, ensuring that as your product grows, Amplitude can keep pace, providing real-time insights no matter the volume of data.
For companies focused on digital products, this focus on user analytics and the ability to scale with user growth makes Amplitude an invaluable tool. It allows businesses to maintain a laser focus on improving user experience and engagement, which is often the key to success in the digital realm.

Related: Check out our free SEO suite

Ease of Use and Learning Curve: Picking the Right Path
This is akin to comparing the ease of following a well-trodden, clearly marked trail to hacking your way through dense underbrush with a machete. Both QlikView and Amplitude offer pathways to treasure troves of insights, but the journey they propose differs significantly in terms of accessibility and the skills required to traverse their landscapes.
QlikView: The Complex Expedition
Embarking on a journey with QlikView is like preparing for a complex expedition. It offers a powerful set of tools for those who know how to use them, but gearing up requires preparation and skill. The platform’s deep customization options and robust data manipulation capabilities are akin to an array of sophisticated navigation instruments and tools; invaluable in the hands of an experienced explorer but overwhelming for a novice.
The learning curve for QlikView can be steep. New users must familiarize themselves with its unique scripting language and data model to fully leverage its capabilities. This investment in learning pays off for businesses looking for detailed, customizable analytics solutions, as it allows for deep dives into data that can uncover hidden insights and connections. However, for teams without dedicated data analysts or those looking for quick insights, this complexity can be a barrier to entry.
Amplitude: The Guided Tour
In contrast, starting your journey with Amplitude is like joining a guided tour. It’s designed to be intuitive, with a focus on providing a user-friendly interface that makes complex data analysis accessible to everyone. Amplitude’s platform is built around understanding user behavior, and it translates this focus into an easy-to-navigate experience for analyzing user interactions with digital products.
Amplitude’s learning curve is considerably gentler compared to QlikView. Users can quickly create dashboards and reports without needing a deep understanding of data science or analytics. This accessibility extends the power of data analysis beyond technical teams to include product managers, marketers, and other non-technical stakeholders. It’s a tool that democratizes data analytics, allowing more members of an organization to engage with and act on data insights.
This ease of use does not mean Amplitude lacks depth. The platform offers powerful analytics capabilities, but it streamlines the process of accessing and understanding these insights. For businesses focused on optimizing digital experiences and eager for a tool that offers quick, actionable insights without a steep learning curve, Amplitude is an attractive option.
Conclusion
As we conclude our exploration of QlikView and Amplitude, it’s clear that the journey through the landscape of analytics tools is both complex and nuanced. Each tool offers its unique strengths, designed to meet specific needs, goals, and challenges businesses face in the realm of data analytics. The choice between QlikView and Amplitude isn’t a matter of one being universally better than the other; it’s about finding the right fit for your organization’s unique journey towards data-driven decision-making.
READ NEXT:
- QlikView vs Zoho Analytics: The Best Analytics Tool for You
- Bitrix24 vs Vtiger: The Best CRM Tool for You
- SugarCRM vs Vtiger: The Best CRM Tool for You
- Vtiger vs Agile CRM: The Best CRM Tool for You
- Elementor vs Thrive Architect: The Best Landing Page Tool for You
- 11 Marketing Analytics Tools to Elevate Your Data-Driven Strategies
- 29+ Digital Analytics Software to Skyrocket Your Digital ROI


Comments are closed.