WinSavvy Editorial Standards
How this article was created
In the vast universe of data analytics, where the stars of insight are obscured by the nebulae of raw information, choosing the right tool to chart your course can feel like navigating by the constellations. Two standout stars, SAS Visual Analytics and Looker, offer distinct paths through the cosmos. One, a veteran voyager with a map for every corner of the analytics universe. The other, a modern explorer equipped with the latest in data telescopes. But which will guide you to the insights you seek? Whether you’re an established data astronomer or a novice stargazer, this guide will be your compass in choosing between SAS Visual Analytics and Looker, helping you find the best analytics tool for your journey.
| SAS Visual Analytics | Looker |
|---|---|
 | |
| G2 Score -4.4 out of 5 | G2 Score -4.4 out of 5 |
| TrustRadius Score -8.4 out of 10 | TrustRadius Score -8.0 out of 10 |
Area of Comparison: Data Integration Capabilities
SAS Visual Analytics: The Seasoned Cartographer
SAS Visual Analytics is like a seasoned cartographer, offering an expansive map of data integration capabilities. With years of experience navigating the data seas, SAS provides robust ETL (Extract, Transform, Load) functionalities, allowing organizations to gather data from a myriad of sources—be it databases, cloud storage, or even spreadsheets. This platform is built for the enterprise explorer, capable of handling vast data landscapes and transforming them into navigable territories.
For organizations charting complex data courses, SAS Visual Analytics offers a dependable compass. Its ability to integrate and cleanse data from diverse origins ensures that analysts are working with the most accurate and comprehensive data sets, ready for deep exploration.
Looker: The Agile Navigator
Looker, on the other hand, sails the data seas with the agility of a clipper ship. Its approach to data integration focuses on speed and flexibility, leveraging the power of in-database processing to bring live data directly into view. Looker’s integration capabilities are built around its modeling language, LookML, which allows users to define data relationships and transformations directly within the database.
This methodology is particularly appealing for organizations seeking to navigate their data in real-time. Looker’s approach minimizes the need for extensive data warehousing efforts, making it easier for businesses to adapt their analytics sails as the winds change, ensuring that insights are always current and accessible.
Pricing: SAS Visual Analytics vs Looker
Pivoting to Pricing, we encounter a critical crossroad that can significantly influence the choice between SAS Visual Analytics and Looker. The investment required for these tools is not just a matter of initial cost but also involves considering the value they bring over time. Let’s examine how each platform positions itself in the market from a financial perspective.
SAS Visual Analytics: Customized Enterprise Investment

SAS Visual Analytics is part of the larger suite of SAS software solutions, tailored predominantly for enterprise-level clients with substantial, complex data analytics needs. Pricing for SAS products, including Visual Analytics, is highly customized. It factors in the scale of deployment, the specific functionalities required, and the level of support and training needed. Organizations interested in SAS Visual Analytics typically need to engage directly with SAS representatives to obtain a quote, reflecting the customized nature of the service.
While detailed pricing information may not be readily available without direct consultation, it’s understood that the investment in SAS Visual Analytics can be significant. This reflects its positioning as a comprehensive, enterprise-grade solution designed to meet a wide range of advanced analytics requirements.
Looker: Transparent and Scalable Options
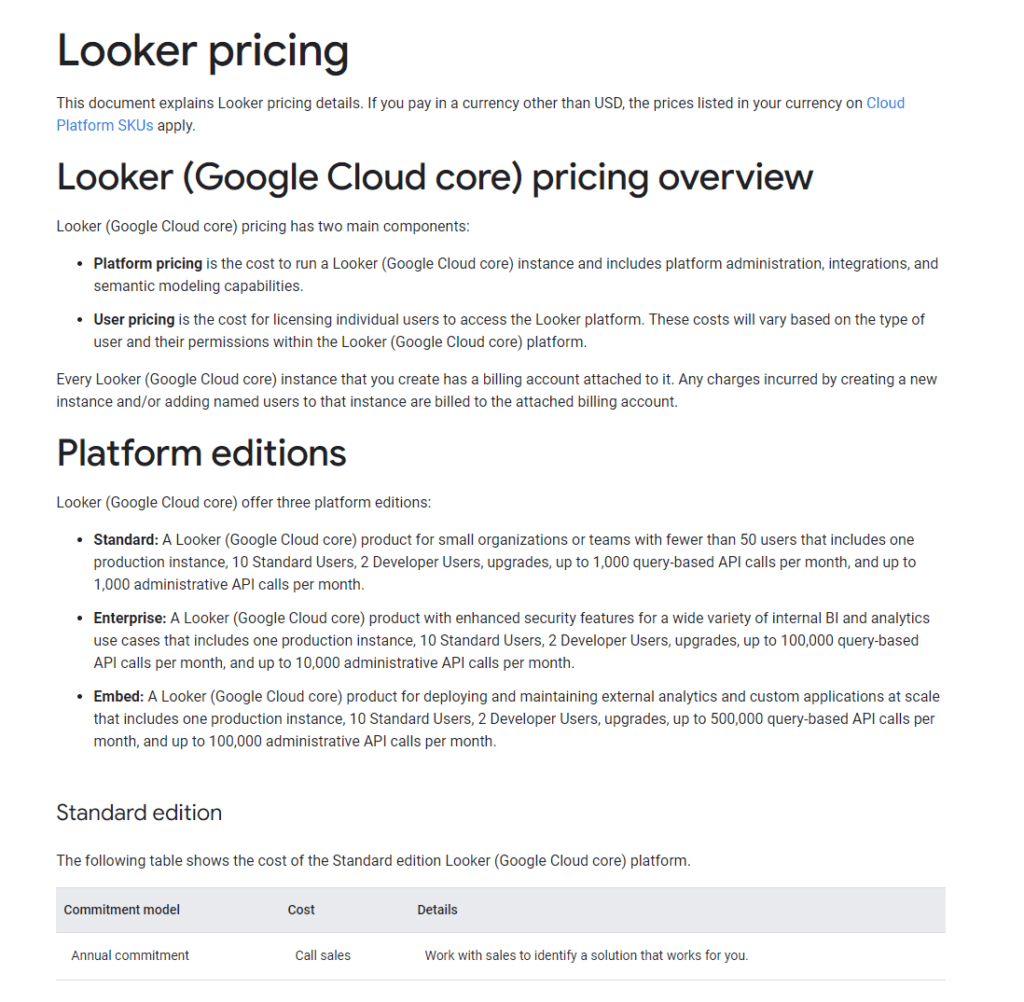
Looker, now part of Google Cloud, offers a more transparent approach to pricing, with details that can be more easily accessed through direct inquiry or through its association with Google Cloud’s pricing models. Looker’s pricing structure is designed to scale with the size and needs of a business, offering flexibility across various tiers. This scalability makes Looker accessible to a broader range of organizations, from small startups to large enterprises.
The platform provides clear paths for scaling up as a business’s data analytics needs grow, with pricing that adjusts based on usage and the specific features required. This approach allows businesses to start with Looker at a smaller scale and expand their investment as they realize the value and ROI from their analytics initiatives.
User Interface and Accessibility
This aspect is pivotal as it affects how users across your organization interact with the tool, uncover insights, and ultimately, the ease with which data-driven decisions can be made. Let’s compare how SAS Visual Analytics and Looker fare in providing users with accessible and intuitive platforms.
SAS Visual Analytics: The Detailed Atlas
SAS Visual Analytics offers a comprehensive suite of tools that cater to users looking for depth and detail in their data exploration. Its interface is akin to a detailed atlas, offering numerous layers of information and sophisticated analytical capabilities. This platform is designed for users who are not daunted by complexity and have a keen eye for detail, providing them with the tools to uncover deep insights.
However, the richness of SAS Visual Analytics’ interface can be a double-edged sword. New users or those with limited technical expertise may find the platform’s extensive features and options overwhelming. Organizations often require a dedicated team of data analysts or extensive training for their staff to fully leverage the platform’s capabilities.
Looker: The Clear Constellation Map
Looker, in contrast, prioritizes clarity and accessibility in its user interface. Designed with modern data exploration in mind, it presents data and insights in a clear, intuitive manner, much like a constellation map that guides users straight to the insights they seek without unnecessary complexity. Looker’s interface and the use of LookML aim to democratize data access, enabling users across the organization, regardless of their technical background, to engage with data and make informed decisions.
This focus on accessibility does not mean Looker compromises on power or flexibility. Users can still perform deep data analysis and access advanced features, but the journey to those insights is guided by a more user-friendly interface that encourages broader adoption within the organization.

Related: Check out our free SEO suite

Advanced Analytics and Machine Learning Capabilities
In an era where predictive insights and automation are not just advantageous but necessary, understanding how SAS Visual Analytics and Looker empower users with these capabilities can provide critical insights into which platform might be the better fit for your organization.
SAS Visual Analytics: The Analytical Oracle
SAS Visual Analytics is part of the SAS ecosystem, renowned for its statistical prowess and analytical depth. It offers a rich set of advanced analytics features, including predictive modeling, machine learning, and complex statistical analysis tools. These capabilities allow users to not just understand past and present trends but also to forecast future scenarios with a high degree of accuracy.
For organizations that rely heavily on data to drive decision-making, SAS provides an almost oracular ability to predict outcomes, identify trends, and uncover hidden patterns within large datasets. The platform is designed for users with a strong analytical background, offering them the tools to create custom models and conduct in-depth analyses.
Looker: The Insightful Guide
Looker takes a different approach, focusing on providing insights through a powerful, yet user-friendly, data exploration interface. While it might not offer the same depth in statistical modeling as SAS, Looker integrates machine learning capabilities through its connection to Google’s BigQuery ML. This integration allows users to apply machine learning models directly to their data within the database, enabling predictive analytics and automated insights without needing to export data or have extensive statistical knowledge.
This makes Looker an attractive option for organizations looking to leverage machine learning to enhance their data-driven decision-making processes. It democratizes access to predictive insights, allowing a broader range of users to benefit from advanced analytics without the steep learning curve traditionally associated with these technologies.
Customer Support and Community Engagement: SAS Visual Analytics vs Looker
Moving forward in our exploration, let’s delve into a crucial aspect often considered towards the end of the decision-making process but is pivotal in ensuring long-term satisfaction and success: Customer Support and Community Engagement. The availability and quality of support, along with an active, engaged user community, can significantly enhance the utility and effectiveness of an analytics tool.
SAS Visual Analytics: Comprehensive Support for Complex Needs
SAS Visual Analytics benefits from SAS’s longstanding reputation and infrastructure, offering comprehensive support that caters to the sophisticated needs of its users. Organizations using SAS Visual Analytics have access to a wide range of support services ,Direct assistance from SAS experts to help resolve complex technical issues.
Rich resources including detailed guides, tutorials, and SAS training courses to help users maximize their use of the platform. A robust, global community of SAS users and experts, providing a platform for knowledge exchange, networking, and support. This extensive support ecosystem is particularly valuable for organizations with complex analytics needs, ensuring they can leverage SAS Visual Analytics’ full potential.
Looker: Agile Support and a Vibrant Community
Looker, now part of Google Cloud, offers a dynamic support experience characterized by its agility and the active engagement of its user community. Looker provides, Access to support through multiple channels, including live chat, email, and a dedicated customer success manager for enterprise accounts.
An extensive library of documentation, how-to guides, and the Looker Discourse community forum for peer support. Opportunities for users to connect, learn, and share insights through user groups and Looker-hosted events, fostering a sense of community and collaboration. Looker’s approach to support and community engagement is designed to be highly accessible, encouraging users to rapidly adopt and effectively utilize the platform, regardless of their technical expertise.
Conclusion
Concluding our exploration of SAS Visual Analytics and Looker, we’ve navigated through the core aspects that differentiate these powerful analytics tools. From their approach to data integration and user interface accessibility to the depth of their advanced analytics and machine learning capabilities, the nuances of their pricing models, and the quality of customer support and community engagement, each platform exhibits unique strengths tailored to distinct organizational needs and analytics strategies.
READ NEXT:
- SAS Visual Analytics vs Optimizely: The Best Analytics Tool for You
- Delivra vs EmailOctopus: The Best Email Marketing Tool for You
- Tailwind vs Kontentino: The Best Social Media Management Tool for You
- AWeber vs EmailOctopus: The Best Email Marketing Tool
- Best Sales Outreach Tools for Your Business: Compared
- 11 Marketing Analytics Tools to Elevate Your Data-Driven Strategies
- 29+ Digital Analytics Software to Skyrocket Your Digital ROI


Comments are closed.