WinSavvy Editorial Standards
How this article was created
In today’s digital odyssey, where every click, view, and interaction weaves the story of your business, choosing the right analytics tool is akin to finding the Rosetta Stone. It’s about decoding the vast data hieroglyphics to reveal actionable insights. In the bustling marketplace of analytics tools, two contenders stand out for their unique capabilities: SAS Visual Analytics and Optimizely. One, a titan of data exploration, offering deep dives into the analytics ocean. The other, a nimble craftsman, shaping the user experience with precision testing. But when it comes to charting the course of your business strategy, which tool is the beacon of light? Whether you’re navigating through the tempest of market trends or seeking to enhance user experience with surgical accuracy, this guide sails into the heart of the SAS Visual Analytics and Optimizely debate to find the best analytics tool for you.
| SAS Visual Analytics | Optimizely |
|---|---|
 |  |
| G2 Score -4.4 out of 5 | G2 Score -4.3 out of 5 |
| TrustRadius Score -8.4 out of 10 | TrustRadius Score -8.6 out of 10 |
Area of Comparison: User Interface and Accessibility
SAS Visual Analytics: The Cartographer’s Compass
SAS Visual Analytics is like an ancient, detailed compass, offering seasoned navigators the tools to chart unknown territories. Its interface is a robust dashboard, rich with functionalities for those who seek to unearth the profound depths of their data. With SAS Visual Analytics, you’re equipped to create complex visualizations, dive into predictive analytics, and tailor your dashboard to mirror the intricacies of your business landscape.
This depth, however, comes with its own set of challenges. New explorers may find themselves navigating a labyrinth, with a steep learning curve that demands dedication. Yet, for organizations armed with data scientists and analytics professionals, SAS Visual Analytics proves to be an invaluable ally, guiding strategic decisions with precision and depth.
Optimizely: The Agile Navigator
Optimizely, in contrast, zips through the digital seas with the agility of a schooner. It’s designed with a laser focus on improving user experiences through A/B testing, multivariate testing, and personalization. The interface of Optimizely is streamlined and intuitive, making it accessible for marketers, product managers, and UX designers to implement tests and quickly glean insights from the results.
The platform shines in its ability to democratize data analysis, ensuring that insights into user behavior and preferences are just a few clicks away. This approachability doesn’t mean Optimizely lacks sophistication; it offers deep dive capabilities into testing analytics, but with an emphasis on user-friendliness and actionability.
Pricing: SAS Visual Analytics vs Optimizely
Exploring Pricing unveils another crucial dimension in deciding between SAS Visual Analytics and Optimizely. This aspect is particularly relevant for organizations balancing the desire for powerful analytics capabilities with budgetary constraints. Let’s navigate through the pricing models of both platforms to understand how they align with different organizational needs and financial considerations.
SAS Visual Analytics: Tailored Enterprise Solutions

SAS Visual Analytics, part of the broader SAS software suite, typically caters to enterprise-level clients with complex, large-scale analytics needs. The pricing for SAS solutions, including Visual Analytics, is often customized based on a variety of factors such as the size of the organization, the scope of the deployment, and specific feature requirements. This tailored approach ensures that organizations receive a solution perfectly matched to their needs but also means that the initial investment can be significant.
Prospective users must contact SAS directly to obtain specific pricing information, as quotes are personalized. While this bespoke pricing model reflects the platform’s comprehensive and powerful analytics capabilities, it also places SAS Visual Analytics in the higher end of the market, making it a significant investment for businesses.
Optimizely: Transparent and Scalable Pricing
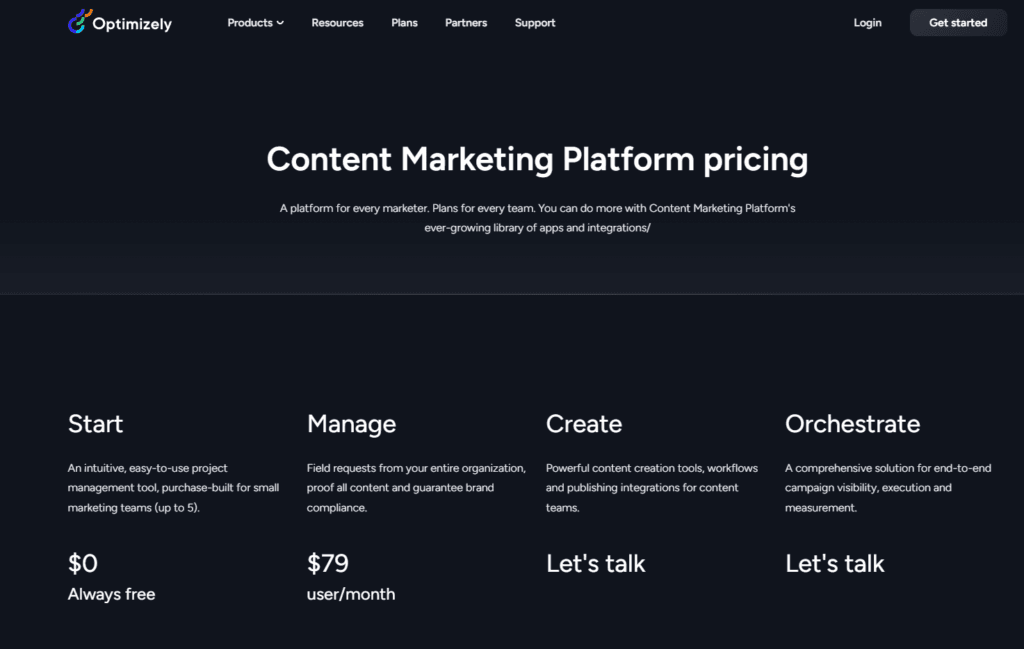
Optimizely offers a more transparent and scalable approach to pricing, with details readily available on its website. Aimed at businesses of various sizes, Optimizely’s pricing model includes several tiers, from free or basic plans suitable for small teams looking to get started with experimentation, to more advanced packages that cater to larger organizations with extensive testing and personalization needs.
Optimizely’s pricing structure is designed to grow with your business, offering the flexibility to scale up as your experimentation and optimization efforts expand. This transparency and scalability make Optimizely an attractive option for businesses seeking clear, predictable costs and the ability to adjust their investment as they grow.
Expanding into Data Integration Capabilities
After exploring the user interface and accessibility, examining how SAS Visual Analytics and Optimizely manage data from various sources is crucial. This exploration could offer insights into the platforms’ ability to consolidate, clean, and manipulate data, which is essential for effective analysis.
SAS Visual Analytics: The Data Integration Powerhouse
SAS Visual Analytics shines when it comes to integrating and managing vast amounts of data from diverse sources. With its robust ETL (Extract, Transform, Load) capabilities, it can seamlessly bring together data from different databases, cloud storage, and even unstructured data formats. This makes SAS Visual Analytics a powerhouse for organizations that deal with complex data environments and require extensive data preparation and cleaning to inform their analysis.
For enterprises or businesses that base their strategic decisions on comprehensive, multi-dimensional analyses, SAS offers the depth and flexibility needed for intricate data manipulation. This capability ensures that users can trust the data at their disposal, laying a solid foundation for insightful analytics.
Optimizely: Streamlined for Experimentation Data
Optimizely takes a more focused approach to data integration, primarily concentrating on data relevant to digital experiments. While it may not boast the wide-ranging ETL functionalities of SAS Visual Analytics, Optimizely excels in effortlessly integrating experimentation data with other sources of digital analytics, such as web analytics platforms and customer data platforms.
This streamlined approach is particularly beneficial for marketing teams and product managers who prioritize speed and agility in their analytics efforts. Optimizely ensures that users can quickly set up experiments, integrate the results with other data insights, and make informed decisions to optimize user experiences.

Related: Check out our free SEO suite

Advanced Analytics and Machine Learning Capabilities
Moving forward in our exploration, let’s pivot to a critical aspect that often decides the real-world applicability and success of an analytics platform within an organization: Advanced Analytics and Machine Learning Capabilities. This dimension is particularly relevant in today’s data-driven landscape, where the ability to not just understand but also predict customer behavior and market trends can set a business apart.
SAS Visual Analytics: The Predictive Powerhouse
SAS Visual Analytics is part of the larger SAS ecosystem, renowned for its advanced analytics and robust statistical capabilities. It offers a wide array of predictive analytics, machine learning models, and statistical analysis tools, making it a powerhouse for organizations that rely on deep, data-driven insights. SAS provides an environment where data scientists and analysts can flourish, offering them the tools to build custom models, perform complex simulations, and generate predictive insights with high accuracy.
This suite of advanced features is designed for organizations that require a detailed understanding of their data to drive strategic decisions. With SAS Visual Analytics, businesses can not only analyze historical data but also forecast future trends, identify potential opportunities, and mitigate risks before they materialize.
Optimizely: Focused on Optimization and Experimentation
While Optimizely might not offer the same breadth of advanced analytics and machine learning tools as SAS, it excels in a niche that is equally important: optimization and experimentation. Optimizely’s platform is designed to make it easy for marketers, product managers, and UX designers to conduct A/B testing, multivariate testing, and more, providing insights into user behavior and preferences.
Optimizely focuses on applying machine learning to optimize user experiences in real-time, offering tools that automatically adjust website elements to improve performance based on user interactions. This approach allows businesses to rapidly iterate on their offerings, making data-informed decisions that enhance user satisfaction and conversion rates.
Customer Support and Community Engagement
The level of support and the vibrancy of the user community around an analytics platform can be critical, especially when navigating complex data challenges or seeking to maximize the tool’s potential.
SAS Visual Analytics: Comprehensive Support for Enterprises
SAS Visual Analytics benefits from SAS’s extensive experience and established reputation in the analytics domain. Users have access to a wide range of support options, including, direct access to experts for resolving complex issues. In-depth guides and manuals covering every aspect of the platform. Opportunities for users to enhance their skills through formal training sessions, both online and in-person.
A large, global community of SAS users provides a network for advice, sharing best practices, and collaboration. This comprehensive support ecosystem is designed to meet the needs of enterprises and organizations with complex analytics requirements, ensuring they can fully leverage SAS Visual Analytics’ capabilities.
Optimizely: Agile Support Focused on Experimentation and Optimization
Optimizely’s approach to support and community engagement reflects its focus on agility and user-centric optimization. Support offerings includes a access to support through multiple channels, including live chat and email, ensuring quick responses to queries. A wealth of online resources, including tutorials, guides, and webinars, helps users get the most out of their experiments.
An engaged user community and regular events foster sharing of insights and strategies among Optimizely users. Optimizely’s support structure is particularly appealing to businesses that value quick, actionable assistance and the opportunity to learn from a community of like-minded professionals focused on improving digital experiences.
Conclusion
In wrapping up our comprehensive journey through the comparison of SAS Visual Analytics and Optimizely, we’ve traversed the landscape of analytics tools, from the nuanced terrains of user interfaces and accessibility to the intricate valleys of data integration capabilities. We’ve scaled the peaks of advanced analytics and machine learning capabilities, navigated the financial waters of pricing strategies, and explored the community islands and support ecosystems that surround these platforms.
Thank you for joining this exploration of SAS Visual Analytics and Optimizely. As the digital and data landscapes continue to evolve, so too will the tools we use to navigate them. The choice between SAS and Optimizely is not just about selecting an analytics tool; it’s about choosing a partner for your journey through the data-driven challenges and opportunities that lie ahead.
READ NEXT:
- Segment vs Woopra: The Best Analytics Tool for You
- SAS Visual Analytics vs Woopra: The Best Analytics Tool for You
- Domo vs Woopra: The Best Analytics Tool for You
- SAS Visual Analytics vs HubSpot Marketing Analytics: The Best Analytics Tool for You
- QlikView vs Baremetrics: The Best Analytics Tool for You
- 11 Marketing Analytics Tools to Elevate Your Data-Driven Strategies
- 29+ Digital Analytics Software to Skyrocket Your Digital ROI


Comments are closed.