
As a startup founder or digital business owner, understanding user behavior on your website is paramount. Without this, optimizing conversion rates is a guessing game. Thankfully, tools like Mouseflow provide insightful user behavior data, enabling you to optimize effectively.
Mouseflow is a comprehensive website analytics tool that helps you understand how visitors interact with your website. It offers features such as session replay, heatmaps, funnels, form analytics, and feedback campaigns to improve your website’s usability and conversion rates.
This explainer will guide you on how to use Mouseflow’s features to boost your website’s performance.
Getting Started with Mouseflow
Before diving into the various features, it’s essential to understand the basics of setting up Mouseflow on your website.
Installation
Mouseflow offers a straightforward installation process. Simply add the provided tracking code to your website’s header or footer, and you’re ready to start collecting user data. It’s compatible with most platforms, including WordPress, Shopify, and Joomla, and even offers integrations for Google Tag Manager.
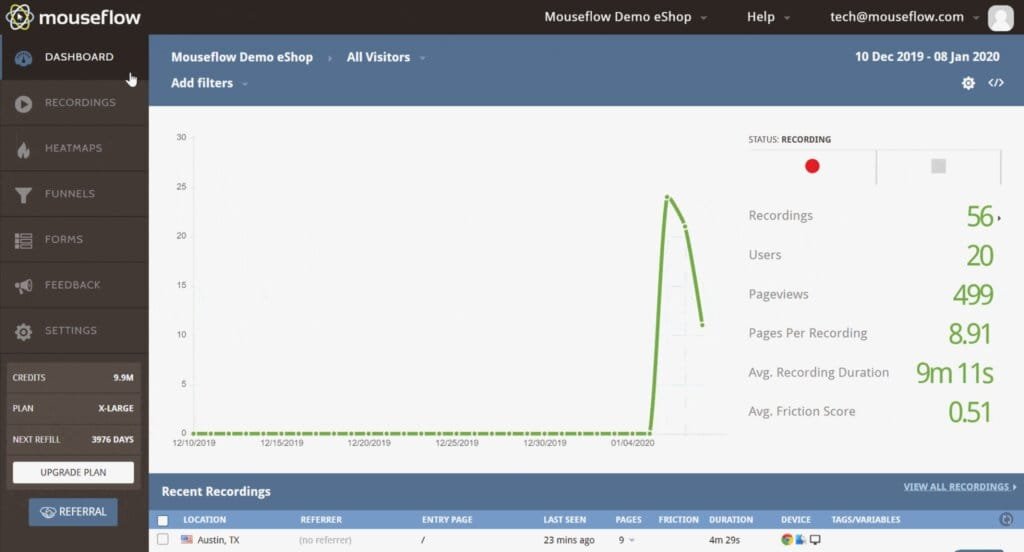
After installation, it’s crucial to ensure that the tool is working correctly. Log into your Mouseflow dashboard and visit your website in a new tab. If your visit is registered on the dashboard, your setup is successful.
Exploring Mouseflow Features
Mouseflow offers several powerful features to help you understand your audience and optimize your website. Let’s take a closer look at each of these.
Session Replay
Session Replay allows you to watch recordings of visitors interacting with your site. You’ll see mouse movements, clicks, scrolls, keystrokes, and form interactions, all of which are immensely helpful to understand user behavior.
To use Session Replay, navigate to the ‘Recordings’ tab on your dashboard. Here, you’ll find a list of all the sessions Mouseflow has recorded. Click on a session to start watching the recording.
Use the playback speed control and timeline markers to navigate the session efficiently. Pay close attention to areas where users seem to struggle or leave the site.
This feature can be more useful when used in conjunction with A/B Testing to evaluate how different designs affect user behavior.
Heatmaps
Heatmaps are a visual representation of user activity on your website. They show where users click, move their mouse, and scroll. Areas with the most activity are highlighted in warm colors, hence the term ‘heatmap’.
Navigate to the ‘Heatmaps’ section in your dashboard to start analyzing user behavior. Mouseflow offers different types of heatmaps including Click, Movement, Scroll, and Attention heatmaps. Each provides a unique perspective on user activity.
Heatmaps can identify problematic design elements that might be hurting conversions. Refer to 21+ Design Elements that Make a Page High Converting and 33 Web Design Features that Hurt Conversions! to fine-tune your page design.
Funnels
Funnels allow you to track the user journey through your site. You can define a series of pages that make up a typical user path and see where users drop off.
To set up a funnel, go to the ‘Funnels’ section of your dashboard. Click ‘New Funnel’ and enter the URLs of the pages in the user journey. Mouseflow will then track user progress through these pages.
Use the Funnel feature to identify where users leave the site and why. Then, you can make data-driven decisions to optimize these pages and improve your conversion rates.
Form Analytics
Mouseflow’s Form Analytics feature is a powerful tool for understanding user interaction with your forms. It provides metrics such as interaction time, completion rate, and drop-off fields.
Access this feature by going to ‘Forms’ in the dashboard. Select a form to analyze, and Mouseflow will provide a comprehensive report.
Pay close attention to fields with high drop-off rates. There might be something about these fields that users find confusing or off-putting.
Feedback Campaigns
Feedback Campaigns enable you to collect qualitative data directly from your users. You can create custom surveys or feedback widgets to gather user opinions about your site.
Navigate to ‘Feedback’ in your dashboard to start a new campaign. You can choose from predefined templates or customize your own. You can decide when and where the feedback widget appears, and what questions to ask.
Feedback Campaigns are a great way to understand what users like or dislike about your site. It’s a valuable supplement to the quantitative data provided by the other features.
Wrapping it up
The optimization of your website should be a continuous process driven by real user data. With a tool like Mouseflow, you can make data-driven decisions to improve your website’s usability and conversion rates. Its features like Session Replay, Heatmaps, Funnels, Form Analytics, and Feedback Campaigns offer detailed insights into your user behavior.
By effectively leveraging these features, you can not only understand your visitors better but also identify and rectify the weak spots in your website’s design and functionality.
Ultimately, the tool you use is just one piece of the puzzle. You’ll also need to learn various conversion rate optimization methods, how to automate lead nurturing, and use marketing analytics tools, among other strategies.
Keep learning, testing, and optimizing! Happy analyzing!
Read Next:
- 51 Email Marketing tools that can skyrocket your email marketing ROI!
- Top SMS Marketing Software: Which one should you pick?
- What Email Marketing Software is best for your small business? Find out


Comments are closed.