WinSavvy Editorial Standards
How this article was created
In today’s whirlwind of data, where every grain holds the potential for breakthrough insights, choosing the right analytics tool isn’t just a decision—it’s a quest. Two titans stand tall in this quest: QlikView and Tableau. Each boasts unique powers to transform data into decisions, but which is the chosen one for your journey? Whether you’re diving into the depths of data for hidden treasures or navigating the vast seas of numbers for actionable insights, this guide is your compass. Let’s set sail on this voyage of discovery to unearth which tool, QlikView or Tableau, is your beacon in the analytics fog.
| QlikView | Tableau |
|---|---|
 |  |
| G2 Score -4.1 out of 5 | G2 Score -4.4 out of 5 |
| TrustRadius Score -8.0 out of 10 | TrustRadius Score -8.2 out of 10 |
Area of Comparison: User Interface and Accessibility
In the realm of data analytics, where the sea of information is endless, the beacon of a user-friendly interface can guide users to clarity and understanding. Let’s delve into how QlikView and Tableau fare in lighting the way with their interface and overall accessibility.
QlikView: The Customizable Compass
QlikView, with its powerful and dynamic interface, offers users a highly customizable compass to navigate their data. It’s designed for those who love to have control at their fingertips, allowing for deep dives into data with complex, tailored visualizations and dashboards. QlikView’s approach caters to organizations that have a dedicated crew of data analysts, ready to tailor the analytics experience to their precise needs.
However, the richness of QlikView’s capabilities comes with a learning curve. New navigators might find themselves adrift, needing time to master its tools and charts. But for those willing to embark on this journey, QlikView promises a world where every analytics need can be met with a customized solution.
Tableau: The Intuitive Map
In contrast, Tableau stands out as an intuitive map, guiding users through their data with ease and elegance. Its interface is celebrated for its user-friendliness, making powerful data visualization accessible to users of all skill levels. Tableau focuses on bringing the joy of exploration to data analytics, with drag-and-drop features and an ability to handle large datasets without overwhelming the navigator.
This accessibility does not mean Tableau is simplistic. On the contrary, it offers deep analytical capabilities and sophisticated visualizations, all within a framework that feels natural to use. For organizations with a diverse crew, from seasoned data sailors to those just getting their sea legs, Tableau offers a way to democratize data analytics, ensuring that insights are not just the realm of experts.
Pricing: QlikView vs Tableau
Venturing into the domain of Pricing, we reach a critical juncture in our exploration of QlikView and Tableau. The cost of adopting an analytics platform is a significant factor for businesses, influencing not only immediate budget considerations but also long-term financial planning. Let’s navigate through the pricing structures of QlikView and Tableau to discern which platform might offer the best value for your organization’s needs.
QlikView: Tailored Costing
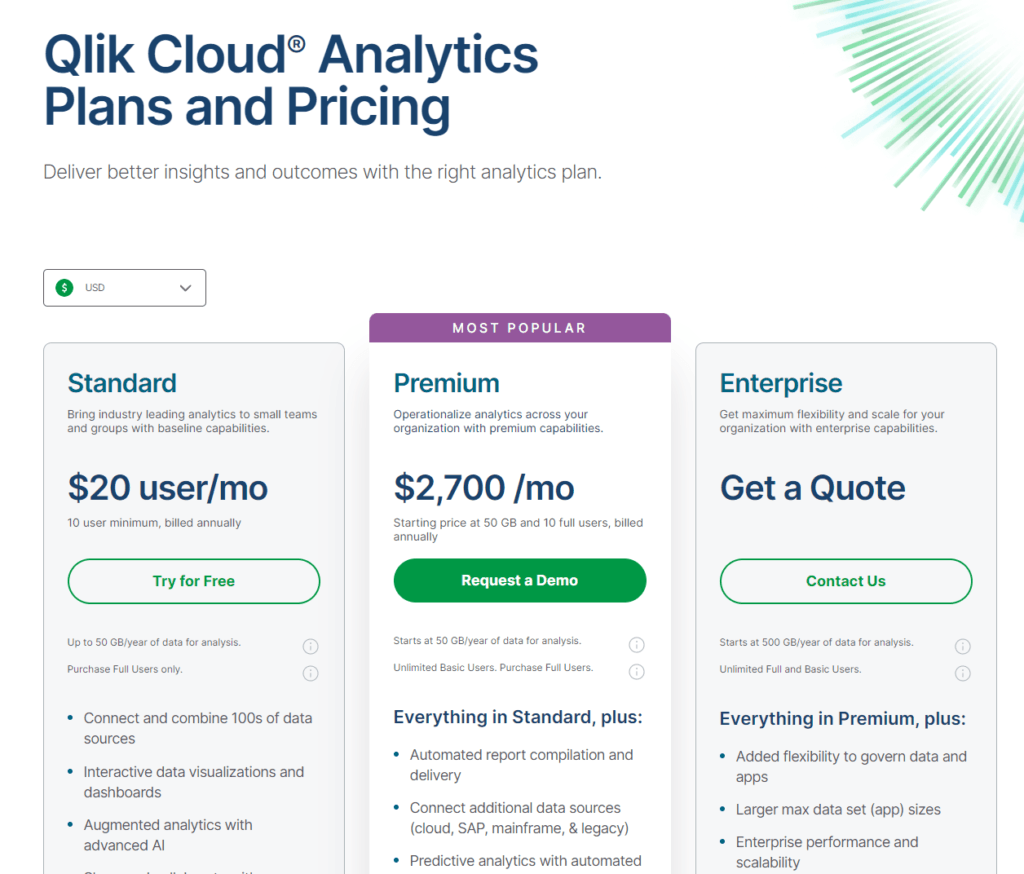
QlikView adopts a pricing model that is as customizable as its analytics capabilities. It typically operates on a license-based model, where the cost is determined by several factors, including the number of users, the server requirements, and the level of access needed (e.g., developer vs. viewer licenses). This flexible approach allows organizations to tailor their QlikView investment to their specific use cases and user base size.
However, the customizability of QlikView’s pricing means that understanding the total cost of ownership can be complex and often requires direct engagement with Qlik’s sales team to get a detailed quote. For larger organizations with specific analytics needs that QlikView addresses, this investment can be highly valuable, providing a powerful platform that precisely fits their requirements.
Tableau: Transparent and Tiered

Tableau, on the other hand, offers a more transparent and straightforward pricing model with clearly defined tiers for individuals, teams, and organizations. Pricing is primarily subscription-based, with different rates for Tableau Creator, Explorer, and Viewer licenses. This tiered approach simplifies the decision-making process for businesses, allowing them to easily understand the cost based on the number of users and their roles.
Tableau’s pricing model is designed to scale with the organization, from single users working on personal projects to large enterprises requiring extensive collaboration and data governance capabilities. The clarity and predictability of Tableau’s pricing make it attractive for businesses of all sizes, ensuring that they can budget for their analytics needs without unexpected costs.
Community Support and Learning Resources: QlikView vs Tableau
Navigating further into the comparison between QlikView and Tableau, it’s important to consider the Community Support and Learning Resources available for each platform. This aspect is crucial for organizations looking to maximize their investment in analytics tools, as it impacts the ease with which team members can learn to use these tools and solve any challenges that arise.
QlikView: A Collaborative Compass
QlikView benefits from a strong, collaborative community of users and developers, including forums, user groups, and extensive online resources. The Qlik Community offers a platform for users to ask questions, share insights, and learn from each other’s experiences. This peer-to-peer support ecosystem is complemented by Qlik’s comprehensive suite of learning resources, including tutorials, webinars, and documentation, designed to help users at all levels enhance their skills with the platform.
Moreover, QlikView’s partnership network provides additional opportunities for learning and support, offering specialized training and services to help businesses fully leverage the platform’s capabilities. This collaborative approach ensures that QlikView users have access to a wealth of knowledge and support as they navigate the complexities of data analytics.
Tableau: Navigating with a Global Crew
Tableau stands out for its vibrant, global community and a wide array of learning resources that cater to users of all expertise levels. The Tableau Community is highly active and welcoming, offering forums, user groups, and social media channels where users can connect, share knowledge, and collaborate on solutions. This global crew of Tableau enthusiasts plays a significant role in democratizing data analytics, making it accessible to a broader audience.
Tableau also offers an extensive range of training materials, including free training videos, hands-on tutorials, and certification programs. These resources are designed to help users from novices to advanced practitioners sharpen their skills and make the most of Tableau’s analytical power. The emphasis on education and community support underscores Tableau’s commitment to fostering a culture of continuous learning and improvement among its users.
Data Integration Capabilities: QlikView vs Tableau
In the journey to uncover actionable insights from vast oceans of data, the ability of your analytics tool to seamlessly integrate data from diverse sources is like having an experienced navigator at the helm. Let’s see how QlikView and Tableau fare in navigating through the complex waters of data integration.
QlikView: The Versatile Voyager
QlikView distinguishes itself with its powerful data integration capabilities, designed to handle a wide variety of data sources, including big data, web services, and databases. Its ETL (Extract, Transform, Load) functionalities are robust, allowing users to bring together disparate data sources into a cohesive analytics environment. QlikView’s associative data model is a significant advantage, enabling users to discover hidden relationships within their data, enhancing the depth and breadth of insights available.
For organizations that navigate through complex data landscapes, QlikView offers the versatility needed to integrate and analyze data from across the entire business spectrum. This makes it an invaluable tool for businesses requiring comprehensive data integration to inform their strategic decisions.
Tableau: The Streamlined Navigator
Tableau, known for its user-friendly interface, also boasts impressive data integration capabilities, allowing users to connect to various data sources with ease. Its approach to data integration focuses on simplicity and efficiency, enabling users to quickly bring together data for analysis without extensive technical know-how. Tableau’s ability to connect live to data sources or to extract data into its in-memory engine offers flexibility in how data is managed and analyzed.
This blend of simplicity and power makes Tableau an attractive option for businesses of all sizes, seeking to democratize data analytics across their teams. It ensures that insights are not just the domain of data specialists but can be accessed and understood by a broader audience within the organization.

Related: Check out our free SEO suite

Advanced Analytics and Machine Learning Capabilities: QlikView vs Tableau
The capacity to not just understand the current state of affairs but to predict future trends and outcomes is akin to having a seasoned soothsayer on board your ship, guiding you through uncharted waters with foresight and wisdom. Let’s see how QlikView and Tableau stand up in this domain.
QlikView: The Insightful Oracle
QlikView offers a suite of advanced analytics features that enable deep data exploration and the discovery of insights that can inform business strategy. While not primarily known for its native machine learning capabilities, QlikView integrates seamlessly with a wide range of external data science and machine learning tools. This integration allows businesses to enrich their QlikView dashboards and reports with predictive analytics, bringing sophisticated forecasting capabilities into their analytical workflows.
QlikView’s strength lies in its flexible data model and powerful in-memory data processing, which supports complex analytical queries and the integration of predictive models crafted in external environments. This makes QlikView a potent tool for organizations that already have data science resources and seek to leverage advanced analytics within their broader data visualization and exploration efforts.
Tableau: The Predictive Navigator
Tableau has made significant strides in incorporating advanced analytics and machine learning capabilities directly within its platform. With features like Tableau Prep for data preparation and the integration of Python and R for statistical modeling, Tableau provides users with tools to not only visualize but also predict and model directly within their analytics environment.
Tableau’s recent enhancements in areas such as AI-driven insights and predictive modeling have further bolstered its position as a leader in making advanced analytics accessible to a broader audience. Users can leverage Tableau to perform sophisticated analyses, including trend predictions and what-if scenarios, without needing to exit the platform or engage in complex integrations.
Final Thoughts
Thank you for joining this comparative journey between QlikView and Tableau. As you stand at the helm, ready to navigate the vast seas of data analytics, remember that the most effective tool is the one that aligns with your strategic vision, empowers your team, and guides your organization towards informed, data-driven decisions.
READ NEXT:
- QlikView vs Statcounter: The Best Analytics Tool for You
- QlikView vs Segment: The Best Analytics Tool for You
- Oracle Analytics Cloud vs MonsterInsights: The Best Analytics Tool for You
- Emma Email Marketing Tool vs Elastic Email: The Best Email Marketing Tool for You
- MicroStrategy vs Amplitude: The Best Analytics Tool for You
- 11 Marketing Analytics Tools to Elevate Your Data-Driven Strategies
- 29+ Digital Analytics Software to Skyrocket Your Digital ROI


Comments are closed.