WinSavvy Editorial Standards
How this article was created
In today’s fast-paced business world, choosing the right analytics tool is more than a matter of preference; it’s a strategic decision that can define the future of your business. With a plethora of options available, two platforms stand out for their robust capabilities and innovative approaches: Tableau and Looker. Both tools promise to transform data into actionable insights, but they cater to different needs and preferences. Our journey begins with a critical look at one of the most fundamental aspects of any software: the User Interface and Experience.
| Tableau | Looker |
|---|---|
| G2 Score – 4.4 out of 5 stars | G2 Score – 4.4 out of 5 stars |
| TrustRadius Score – 8.2/10 | TrustRadius Score – 8/10 |
User Interface and Experience

The interface of an analytics tool is the gateway through which all data must pass, making it a critical component of your daily interaction with data. An intuitive, user-friendly interface can significantly enhance productivity and data exploration, leading to deeper insights.
Tableau: Intuitive Design for Diverse Data Exploration
Tableau is renowned for its intuitive and flexible user interface, which caters to users of all levels, from beginners to data scientists. Its drag-and-drop functionality simplifies the creation of complex visualizations, making data analysis accessible to everyone.
The interface encourages experimentation, allowing users to explore data from various angles quickly. This user-centric design not only makes Tableau a powerful tool for data analysis but also a pleasure to use, fostering a culture of data curiosity and continuous discovery.
Looker: Streamlined and Customizable for Data-Driven Decisions
Looker takes a slightly different approach, focusing on a streamlined and customizable user experience. It leverages LookML, its proprietary modeling language, to create a tailored analytics environment that fits the specific needs of each business. While this might introduce a steeper learning curve compared to Tableau, it also offers greater control over data modeling and reporting.
Looker’s interface is designed to facilitate data-driven decision-making, with a focus on delivering the right insights to the right users. Its emphasis on customization ensures that businesses can fine-tune their analytics experience to align closely with their operational workflows.
Data Integration Capabilities
This aspect is pivotal for businesses that rely on diverse data sources for comprehensive analytics and informed decision-making. In the modern data landscape, the ability to seamlessly integrate various data sources into a single analytics platform is invaluable. It ensures that businesses can leverage all their data for holistic insights, regardless of where it resides.
Tableau: Wide-Ranging Data Connectivity

Tableau stands out for its exceptional data integration capabilities, offering support for a vast array of data sources, including cloud databases, on-premise servers, flat files, and web data connectors. This wide-ranging connectivity enables businesses to bring together data from disparate sources into one cohesive analytical view.
Tableau’s flexibility in handling different data types and sources ensures that users can quickly and easily access and analyze their data without the need for extensive data preparation or transformation efforts. This ease of integration is a significant advantage for organizations that rely on a diverse data ecosystem.
Looker: Seamless Integration with a Modern Approach

Looker approaches data integration with a modern twist, emphasizing its in-database architecture. It connects directly to your database, allowing for real-time analytics without the need to move or replicate data. This approach not only streamlines the data analysis process but also minimizes the risk of data silos. Looker’s LookML modeling layer offers an additional level of integration, enabling users to define business logic and data relationships directly within the platform.
This feature ensures that analyses are consistent across the organization and that data governance is maintained. While Looker’s approach is highly efficient, it requires that all data be accessible through the connected databases, which might be a limitation for businesses with data spread across multiple platforms or offline sources.
Customer Support and Learning Resources

In the realm of data analytics, where technologies and best practices are constantly evolving, having access to responsive customer support and comprehensive learning resources can significantly impact the success and adoption of the platform within an organization. The availability and quality of customer support and educational materials provided by an analytics platform play a crucial role in enabling users to overcome challenges and maximize the tool’s utility.
Tableau: Extensive Learning Ecosystem
Tableau is renowned for its expansive ecosystem of learning and support resources. This includes a detailed knowledge base, active user forums, free training videos, and live webinars that cater to users of all skill levels. Tableau also offers in-person training sessions and certifications for those looking to deepen their expertise.
This wealth of resources ensures that users can quickly find answers to their questions and continue to grow their skills over time. Tableau’s commitment to fostering a learning community not only helps users solve technical issues but also encourages the exploration of new ways to visualize and analyze data.
Looker: Focused Support and Tailored Resources

Looker offers a targeted approach to customer support and education, focusing on ensuring that users can effectively utilize its platform for their specific analytics needs. This includes access to comprehensive documentation, a responsive support team, and Looker’s Discourse community forum where users can ask questions and share insights.
Looker University provides a series of self-paced and instructor-led training options, designed to help users understand LookML and make the most of Looker’s unique features. While Looker’s resources are more specialized, they are deeply informative and tailored to the platform’s capabilities in data modeling and analytics.

Related: Check out our free SEO suite

Scalability and Performance
As businesses grow, so does their data and the number of users accessing this data. A scalable analytics tool must efficiently manage increased demand without compromising on performance or user experience. Scalability in analytics tools involves the capacity to handle growing amounts of data and an increasing number of users, while performance relates to the speed and efficiency with which the tool processes data and generates insights.
Tableau: Built for Growth and Flexibility
Tableau is designed to scale with your business, accommodating everything from small datasets used by individual teams to massive datasets analyzed across multinational corporations. It offers various deployment options, including Tableau Desktop for individual users, Tableau Server for on-premise solutions, and Tableau Online for cloud-based analytics.
This flexibility ensures that businesses of all sizes can use Tableau effectively, scaling up as their data analytics needs grow. Tableau’s performance is also a strong point, with efficient data processing capabilities that minimize wait times for complex visualizations and reports, ensuring that decision-making is not delayed by data analysis.
Looker: Modern Architecture for Scalable Analytics
Looker’s platform, built on a modern web-based architecture, is inherently scalable. Its unique approach of using LookML to model data directly on the database leverages the underlying database’s performance and scalability. This means that as your database grows and scales, Looker seamlessly keeps pace, providing consistent performance without the need for additional configuration.
The in-database analytics approach ensures that data is not duplicated or moved, reducing bottlenecks and maintaining fast response times, even as data volume grows. Looker’s scalability extends to user access as well, enabling businesses to democratize data access across the organization without sacrificing performance.
Data Security and Compliance

In an era where data breaches are not uncommon, the security measures and compliance protocols of an analytics tool are paramount. Businesses must ensure their data analytics practices adhere to global data protection regulations like GDPR, HIPAA, or CCPA, depending on their operational geographies and sectors.
The commitment of an analytics platform to data security and its ability to help users comply with legal standards can significantly impact its suitability for business use.
Tableau: Comprehensive Security at Every Level
Tableau provides robust security features designed to protect data at every stage of the analytics process. It offers multiple layers of security including network security, data encryption at rest and in transit, and row-level security to ensure that sensitive information is accessible only to authorized users.
Tableau’s governance capabilities also allow administrators to closely monitor and manage user access and activities, further enhancing data protection. Additionally, Tableau complies with a wide range of international and industry-specific regulations, making it a reliable choice for businesses concerned with adhering to strict data protection standards.
Looker: Secure and Compliant Data Analytics
Looker also places a high priority on data security and regulatory compliance. Its platform is built on a modern, cloud-based infrastructure that ensures data is securely managed and accessed. Looker leverages the security features of the host cloud provider (Google Cloud Platform, for instance) and adds its layers of data encryption, user authentication, and fine-grained access controls.
Moreover, Looker’s approach to data modeling and analytics, which operates directly on the database without extracting data, inherently minimizes the risk of data exposure. Looker meets various compliance certifications, reassuring users of its commitment to data security and legal standards.
Collaboration and Sharing Features
In today’s interconnected work environments, the ability for teams to collaborate effectively on analytics and share insights seamlessly is not just convenient; it’s essential for driving informed decision-making across an organization. The tools and features that an analytics platform offers for collaboration and sharing can significantly impact how insights are disseminated and acted upon within a company.
Tableau: Facilitating Collaborative Analytics
Tableau excels in supporting collaboration through its robust set of features designed to share insights and engage teams. With Tableau Server and Tableau Online, users can publish dashboards to a central location where team members can access, interact with, and even modify shared analyses, depending on their permission levels.
Comments and discussions can be attached directly to data visualizations, fostering a collaborative environment where insights and feedback are exchanged openly and efficiently. Tableau’s strong focus on making data accessible and understandable encourages a culture of data-driven decision-making throughout the organization.
Looker: Streamlined Sharing within an Integrated Environment
Looker promotes collaboration through its integrated data platform, which centralizes analytics to ensure consistency and accessibility. Dashboards and reports can be easily shared among users within the Looker environment, with controls for governing who can view or interact with the data. The platform also supports embedding analytics into other applications and websites, extending the reach of data insights beyond Looker users.
This approach ensures that data-driven findings are readily available to all stakeholders, integrated directly into the tools and workflows they use daily. Looker’s emphasis on consistent, accessible data models via LookML also means that teams work from a single source of truth, reducing discrepancies and fostering unified insights.
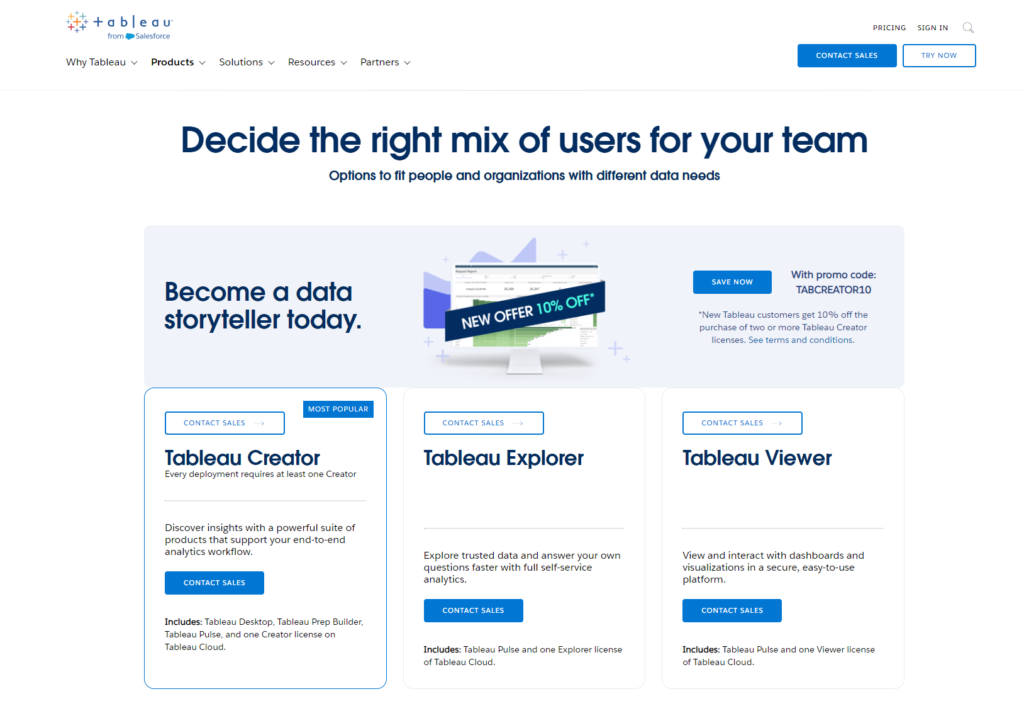
Pricing
Tableau:
Looker:

Conclusion
In our comprehensive comparison between Tableau and Looker, we’ve traversed through key considerations such as user interface and experience, data integration capabilities, scalability and performance, data security and compliance, collaboration and sharing features, and customer support and learning resources. Both platforms exhibit strengths in distinct areas, tailored to meet different organizational needs and user preferences.
Tableau shines with its intuitive design, wide-ranging data connectivity, scalability to accommodate growth, and a vast array of learning resources and community support. It’s suited for businesses seeking a robust, versatile analytics tool that can handle complex data analysis across various departments and skill levels.
Looker, on the other hand, offers a modern approach to data analytics with its in-database architecture, ensuring real-time insights and scalability. Its focus on data modeling and customizability, along with targeted support and education, makes it ideal for companies prioritizing streamlined, consistent data analysis and governance.
Read Next:


Comments are closed.