In the digital age, where data is as valuable as gold, choosing the right analytics tool can feel like navigating a maze. Enter GoSquared and Tableau, two giants in the analytics world, each offering unique powers to help you conquer your data dragon. But as with any epic quest, the question looms: which hero should you enlist in your journey? Fear not, for we’re here to guide you through this adventure with insights, comparisons, and perhaps a bit of fun. Whether you’re a startup knight, a medium-sized merchant, or a large enterprise wizard, we’ve got something for everyone. Let’s kick off this tale with a look into the realm of user-friendliness and ease of setup.
| GoSquared | Tableau |
|---|---|
 |  |
| G2 Score -4.6 out of 5 | G2 Score -4.4 out of 5 |
| TrustRadius Score -9.0 out of 10 | TrustRadius Score -8.2 out of 10 |
Ease of Setup and User-Friendliness: The First Steps into the Analytics Kingdom
Imagine stepping into a vast, unknown kingdom. Your success in navigating this world depends on how quickly and easily you can understand its laws (setup) and communicate with its inhabitants (user-friendliness). In the case of GoSquared and Tableau, these factors are pivotal in determining which tool will be your ally.
GoSquared: The Welcoming Village
GoSquared is like entering a friendly village where everything is designed for your comfort. Setting up GoSquared is a breeze, akin to a warm welcome from the villagers. You don’t need to be a seasoned adventurer or a data wizard to get started. With just a few clicks, you’re up and running, tracking real-time visitors, analyzing trends, and engaging with users. The dashboard is intuitive, almost as if the village elders designed it with guidance from every traveler who passed through, ensuring that even the newest visitors can navigate its paths with ease.
The true charm of GoSquared lies in its ability to make complex data seem simple. Whether you’re looking at visitor analytics, customer behavior, or real-time engagement, everything is presented in a way that’s easy to understand and act upon. It’s the perfect tool for those who value simplicity and directness in their quest for knowledge.
Tableau: The Majestic, Sprawling City
Then there’s Tableau, resembling a vast, sprawling city filled with intricate architecture and endless possibilities. The setup might feel overwhelming at first, like trying to find your way through bustling streets and grand plazas. However, once you acclimate, you realize the city’s design is a masterpiece of efficiency and depth.
Tableau’s power lies in its robust analytics capabilities, capable of handling complex datasets and delivering insights through stunning visualizations. It’s a tool built for those who are not afraid of diving deep into data, offering the flexibility to explore every nook and cranny of information. The interface, though more complex than GoSquared’s, is a testament to Tableau’s commitment to providing powerful analytics tools. With a bit of patience and exploration, it becomes a trusted guide through the data labyrinth.
Pricing: The Key to the Treasure Chest
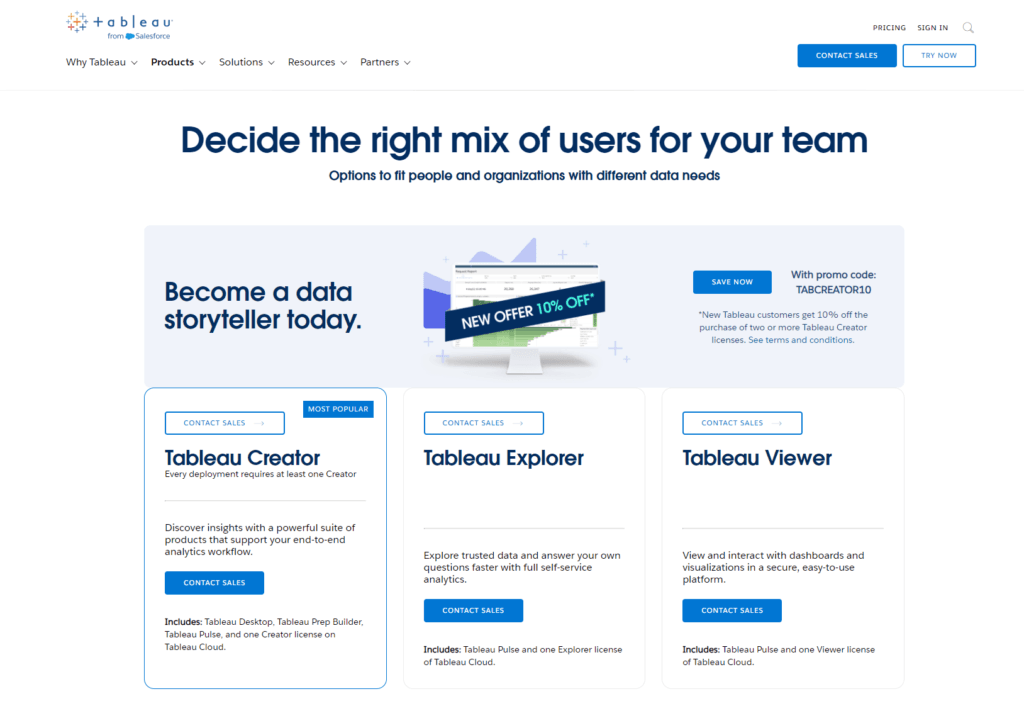
In any quest, knowing the cost of your tools and the value they bring is essential. GoSquared and Tableau, while both offering powerful insights, take different paths when it comes to pricing their services. Let’s delve into their worlds to uncover the secrets of their pricing structures.
GoSquared: Simple Paths to Value

GoSquared aims to keep the journey straightforward, with clear, transparent pricing paths that cater to different types of adventurers. Whether you’re a solo explorer or leading a large expedition, GoSquared has a plan that maps to your needs. Starting with a free trial is like having a map handed to you, allowing you to explore the landscape of GoSquared’s features without committing your gold upfront.
For small to medium businesses embarking on their journey, the Starter Plan is akin to a reliable compass, guiding your way with essential analytics features at a cost-effective price point. As your expedition grows, so do your needs. GoSquared’s Growth and Premium plans offer more advanced features, akin to uncovering hidden paths and treasures on your map, enabling deeper insights and broader data horizons.
Tableau: Crafting Your Own Map

Tableau approaches pricing like a cartographer offering you the tools to craft your own map. It provides a range of options that cater to individual explorers, teams setting up camp, and large enterprises embarking on grand voyages. For the solo data adventurer, Tableau offers individual plans that provide powerful visualization tools without requiring a large crew or resources.
As your team grows, Tableau’s team and organization plans come into play, offering the ability to share insights and collaborate on your data maps, ensuring that everyone in your expedition is on the same path. For the largest and most complex voyages, Tableau can tailor a solution to fit your exact needs, akin to commissioning a master cartographer to chart your unique course.
Data Visualization and Reporting: Painting the Picture of Your Data
In the realm of analytics, data visualization and reporting are akin to the art of storytelling. It’s where the raw, unstructured data is transformed into a compelling narrative that can be easily understood and acted upon. Let’s see how our contenders, GoSquared and Tableau, wield their brushes in this artistry.
GoSquared: The Clear, Concise Storyteller
GoSquared approaches data visualization with the philosophy that less is more. It focuses on providing clear, concise reports that distill the essence of your data into actionable insights. The dashboard and reporting tools are designed to be straightforward, ensuring that you can quickly grasp your site’s performance and user behavior without getting bogged down in complexity.
Imagine sitting by a campfire, listening to a storyteller. They capture your imagination with a tale that’s easy to follow yet full of meaning. That’s GoSquared’s reporting for you. It might not have the elaborate decorations of a royal epic, but it delivers the story of your data in a way that’s engaging and immediately useful. Whether it’s real-time analytics, funnel analysis, or visitor segmentation, GoSquared tells you what you need to know in a format that’s easy to digest and act on.
Tableau: The Master of Epic Sagas
Tableau, on the other hand, is like the bard who weaves intricate tales of heroes, villains, and adventures across diverse landscapes. It offers a powerful platform for data visualization that can turn the most complex datasets into stunning visual stories. With Tableau, you’re not just looking at numbers and charts; you’re immersing yourself in a data-driven narrative that can be customized to the smallest detail.
The strength of Tableau lies in its flexibility and depth. You can create highly detailed reports, dashboards, and visualizations that cover every facet of your data. From heat maps and scatter plots to complex temporal analyses, Tableau gives you the tools to explore your data from every angle. It’s ideal for businesses and analysts that need to dive deep into their data, uncovering trends and insights that would remain hidden in simpler narratives.

Related: Check out our free SEO suite

Integration and Scalability: Growing with Your Quest
In the world of analytics, the power to integrate with other tools and scale as your needs evolve is like having a magic wand that adapts to your journey’s changing demands. Let’s see how GoSquared and Tableau equip you with such magic.
GoSquared: Seamless Connections in Your Village
GoSquared functions like the central gathering place in your village, where various paths meet and integrate smoothly. It’s designed to connect effortlessly with other tools in your digital ecosystem, from marketing platforms to customer service applications. This seamless integration ensures that your journey through data analytics is not a solo adventure but a collaborative quest with every tool in your arsenal.
GoSquared’s ability to integrate with email marketing services and CRM platforms means that your insights can directly inform your marketing campaigns and customer interactions, making your efforts more targeted and effective. By integrating live chat and customer engagement tools, GoSquared enables you to act on your analytics in real-time, engaging with visitors and customers precisely when they’re most engaged with your content.
As for scalability, GoSquared is like a trusty steed that grows stronger and more capable as your adventure progresses. Whether you’re expanding your village or venturing into new territories, GoSquared scales with you, ensuring that your analytics capabilities keep pace with your growth.
Tableau: The Expansive Kingdom of Data
Tableau, in contrast, is like an expansive kingdom that connects to countless domains, offering unparalleled flexibility in integration. Its power lies in its ability to blend data from virtually any source, be it a simple spreadsheet or complex databases, and present it in a cohesive and comprehensible manner. This makes Tableau a potent tool for kingdoms large and small, allowing for deep data exploration and insight generation.
With Tableau, you can connect to data in real-time, whether it’s stored in the cloud, on-premises, or in a hybrid environment. This extensive integration capability ensures that you have a 360-degree view of your kingdom, drawing insights from every corner of your realm. Tableau is built to scale, capable of handling the vast data landscapes of large enterprises. As your kingdom grows, Tableau’s infrastructure and capabilities grow with you, ensuring that your data analytics can meet the needs of even the most complex and demanding quests.
Conclusion
As we conclude our journey through the contrasting landscapes of GoSquared and Tableau, we’ve traversed the realms of user-friendliness, data visualization, pricing, and integration capabilities. Each tool, like a trusted companion on a quest, offers its own strengths, quirks, and suitability for different types of adventurers in the vast domain of analytics.
READ NEXT:
- Affiliate Marketing for the Fitness Industry: Promoting Workouts and Health Supplements
- Content Length and SEO: Finding the Right Balance
- “GoSquared vs Statcounter: The Best Analytics Tool for You”
- “GoSquared vs Segment: The Best Analytics Tool for You”
- 29+ Digital Analytics Software to Skyrocket Your Digital ROI
- 11 Marketing Analytics Tools to Elevate Your Data-Driven Strategies
- Best SEO Tools in 11 Categories to Elevate Your SEO


Comments are closed.