WinSavvy Editorial Standards
How this article was created
In today’s data-driven business environment, choosing the right analytics tool is a pivotal decision that can shape the trajectory of your company. Statcounter and Tableau stand out in the digital landscape, but for very different reasons. Statcounter, with its straightforward approach, offers website analytics that are easy to understand and act upon, making it a favorite for small businesses and individual website owners. Tableau, on the other hand, is a powerhouse of data visualization, providing comprehensive tools that turn complex data sets into actionable insights for businesses of all sizes. This article delves into these platforms, helping you decide which one aligns best with your analytics needs. Let’s start by comparing their User Interface and Ease of Use.
| Statcounter | Tableau |
|---|---|
| G2 Score – 4.3 out of 5 stars | G2 Score – 4.4 out of 5 stars |
| TrustRadius Score – 9/10 | TrustRadius Score – 8.2/10 |
User Interface and Ease of Use

The accessibility of an analytics tool’s user interface directly impacts its adoption and the efficiency of deriving actionable insights from data. Here’s how Statcounter and Tableau compare in terms of user friendliness and learning curve.
Statcounter: Simplicity and Accessibility

Statcounter is designed with simplicity in mind. Its dashboard and reporting tools are straightforward, making it easy for users to track website traffic, visitor behavior, and other essential metrics without a steep learning curve. This simplicity is Statcounter’s strength, offering immediate value to users who need basic website analytics without the complexity of more advanced tools.
For small businesses, bloggers, and individuals managing their websites, Statcounter provides a no-frills approach that allows for quick setup and immediate insight into website performance. However, this simplicity comes at the cost of depth, as Statcounter may not offer the granularity or advanced analytics capabilities found in more robust platforms.
Tableau: Comprehensive and Customizable

Tableau represents the other end of the spectrum, offering a rich, customizable interface that caters to a wide range of data visualization needs. Its dashboard and reporting capabilities are highly advanced, allowing users to dive deep into data analysis with powerful tools that support extensive customization and exploration. Tableau’s interface is designed to handle complex data sets, providing insights that can inform strategic decisions at every level of a business.
The trade-off with Tableau’s comprehensive capabilities is a steeper learning curve. New users may find the array of options and tools daunting, and maximizing Tableau’s potential often requires dedicated time for learning and experimentation. However, for businesses that require detailed analytics and the ability to visualize complex data relationships, Tableau is unparalleled.
Data Analysis Capabilities

Both Statcounter and Tableau offer analytics capabilities, but they serve very different purposes and offer varying levels of depth in data analysis. The depth and breadth of data analysis available can significantly impact the insights you draw and the decisions you make for your business.
Statcounter: Focused on Website Analytics

Statcounter is primarily designed to provide website owners with clear, concise insights into visitor behavior. It excels in tracking page views, sessions, bounce rates, and referral sources. Statcounter’s strength lies in its ability to deliver real-time data, allowing website owners to see immediate effects of changes or marketing efforts. This platform is particularly valuable for users who need to monitor website performance metrics without the complexity of larger data sets.
While Statcounter offers essential analytics that can help optimize website performance and user experience, it does not delve into the more complex data analysis and visualization capabilities that some businesses may require. Its focus is on accessibility and immediacy, which suits small to medium-sized businesses and individuals who need straightforward insights.
Tableau: Advanced Data Visualization and Analysis

Tableau, in contrast, offers a comprehensive suite of data analysis tools designed to handle complex data from multiple sources. It is not limited to website analytics but can integrate data from various platforms to provide a holistic view of business operations. Tableau’s powerful data visualization capabilities allow users to create interactive dashboards and reports that can uncover trends, patterns, and insights not immediately visible in raw data.
The platform supports advanced analytical functions like predictive analytics, trend analysis, and complex calculations, making it an ideal tool for businesses that rely on data-driven strategies to guide decision-making processes. Tableau is best suited for medium to large businesses or those with specific needs for in-depth data analysis across multiple data sources.

Related: Check out our free SEO suite

Customization and Flexibility

The ability to tailor the analytics platform to meet specific business needs can greatly enhance its value, enabling more precise insights and decisions. The degree to which an analytics tool allows for customization can significantly impact its effectiveness and alignment with your business objectives.
Statcounter: Streamlined Customization

Statcounter provides a straightforward, user-friendly analytics experience focused on essential website metrics. Its customization options are designed to be accessible, allowing users to easily select which metrics to monitor closely and set up alerts for specific events. This level of customization is adequate for most small to medium-sized websites looking to gain insights into visitor behavior without the need for complex data manipulation.
However, the simplicity that makes Statcounter appealing also means that it may not offer the same level of flexibility as more comprehensive tools. For businesses with unique or highly specialized data analysis needs, Statcounter’s customization options might be somewhat limiting.
Tableau: Extensive Customization and Flexibility
Tableau stands out for its extensive customization capabilities, offering users complete control over their data analysis and reporting processes. Users can create custom dashboards and reports from scratch, tailor visualizations to precise specifications, and integrate data from virtually any source. This flexibility makes Tableau an exceptionally powerful tool for businesses that require detailed, specific insights that generic analytics solutions cannot provide.
Moreover, Tableau’s flexibility extends to data manipulation and exploration, allowing users to drill down into their data, perform complex calculations, and explore various scenarios through “what-if” analyses. This level of customization and flexibility makes Tableau well-suited for organizations with complex data ecosystems or those that rely heavily on data-driven decision-making.
Integration Capabilities
The ability of an analytics tool to integrate with other software and platforms determines how well it can fit into and enhance your existing workflows and data processes. The ease with which an analytics platform can integrate with other tools and services is crucial for creating a seamless flow of data across your business’s technology ecosystem.
Statcounter: Focused Integration

Statcounter’s integration capabilities are primarily focused on providing straightforward website analytics. It integrates directly with websites through a simple code snippet, making it incredibly easy to start tracking visitor data almost immediately. While this ensures ease of use and quick setup, Statcounter’s integration with other business tools and platforms is somewhat limited compared to more comprehensive analytics solutions. Its focus remains on delivering direct, actionable insights into website performance without the complexity of broader data ecosystems.
Tableau: Broad Ecosystem Compatibility
Tableau shines in its ability to integrate with a wide variety of data sources, from simple spreadsheets to complex databases and cloud services. This broad integration capability allows businesses to pull data from multiple sources into Tableau, creating a unified view of information across the organization. Tableau’s flexibility in handling different data types and sources is a key strength, enabling deep analysis and visualization that encompasses all aspects of business operations.
Furthermore, Tableau’s extensive API support and developer tools mean that it can be customized to integrate with almost any platform, enhancing its utility as a central piece of a business’s data analysis infrastructure. This level of integration capability makes Tableau particularly valuable for businesses that rely on diverse data sources and require a comprehensive analytics tool that can bring all that data together cohesively.
Cost and Investment

Understanding the pricing structure and overall cost-effectiveness of each analytics platform is crucial for businesses aiming to maximize their analytics capabilities within their budget constraints. The financial commitment involved in deploying an analytics tool and the return on that investment can significantly influence the decision-making process for businesses of all sizes.
Statcounter: Affordability for Small to Medium Websites
Statcounter is known for its straightforward and accessible pricing model, designed to cater to small and medium-sized businesses or individual website owners. Offering both free and premium plans, Statcounter makes it easy for users to start with basic website analytics without any upfront investment. The free version provides a solid foundation of analytics features, with limitations on log size and data history.
As businesses grow or require more in-depth analytics, Statcounter’s premium plans offer increased data capacity and additional features at a relatively low cost. This scalable pricing model ensures that businesses only pay for what they need, making Statcounter a cost-effective option for those with straightforward analytics needs.
Tableau: Comprehensive Analytics with a Higher Price Point
Tableau, offering a more comprehensive suite of data analysis and visualization tools, typically comes with a higher price point. Its pricing structure is designed to accommodate the needs of medium to large businesses and enterprises that require extensive data integration, sophisticated analysis capabilities, and advanced visualization options. Tableau provides several licensing options, including individual, team, and enterprise plans, each tier offering more features and greater scalability.
The investment in Tableau can be justified by the advanced analytics capabilities it provides, enabling businesses to derive deep insights that can drive significant improvements in strategy and operations. For organizations that depend heavily on data-driven decision-making across multiple departments, Tableau’s cost is often outweighed by the value it delivers in terms of actionable insights and business intelligence.
Pricing
Statcounter:
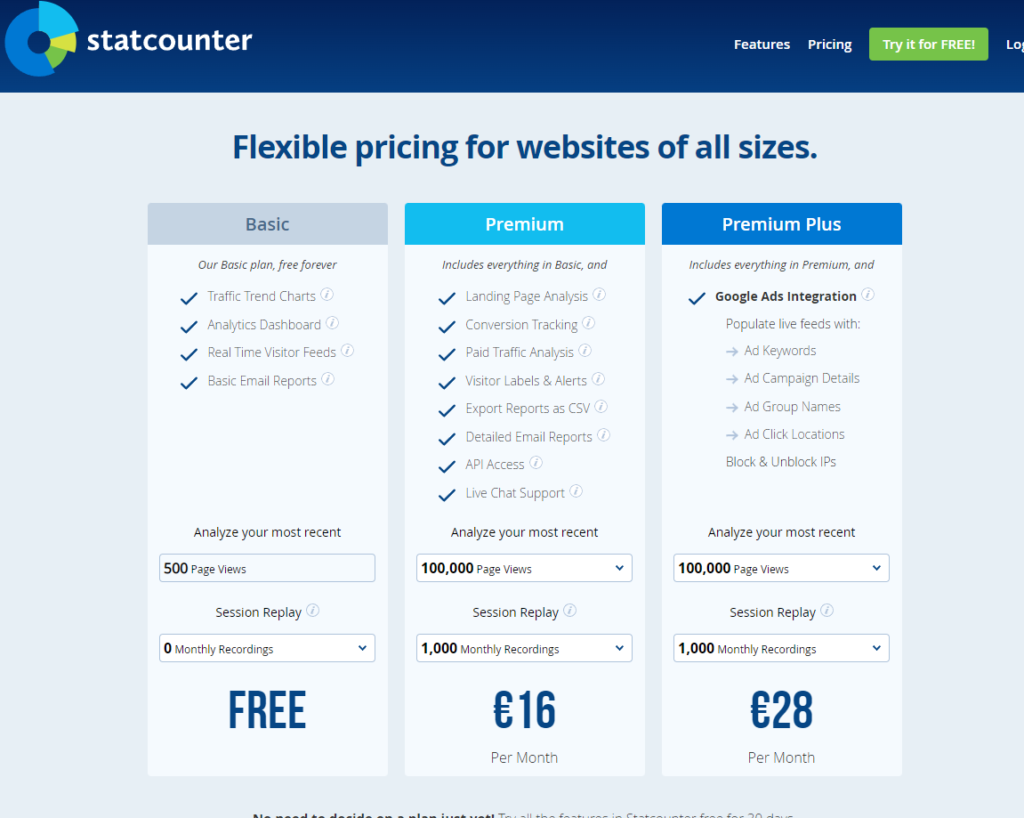
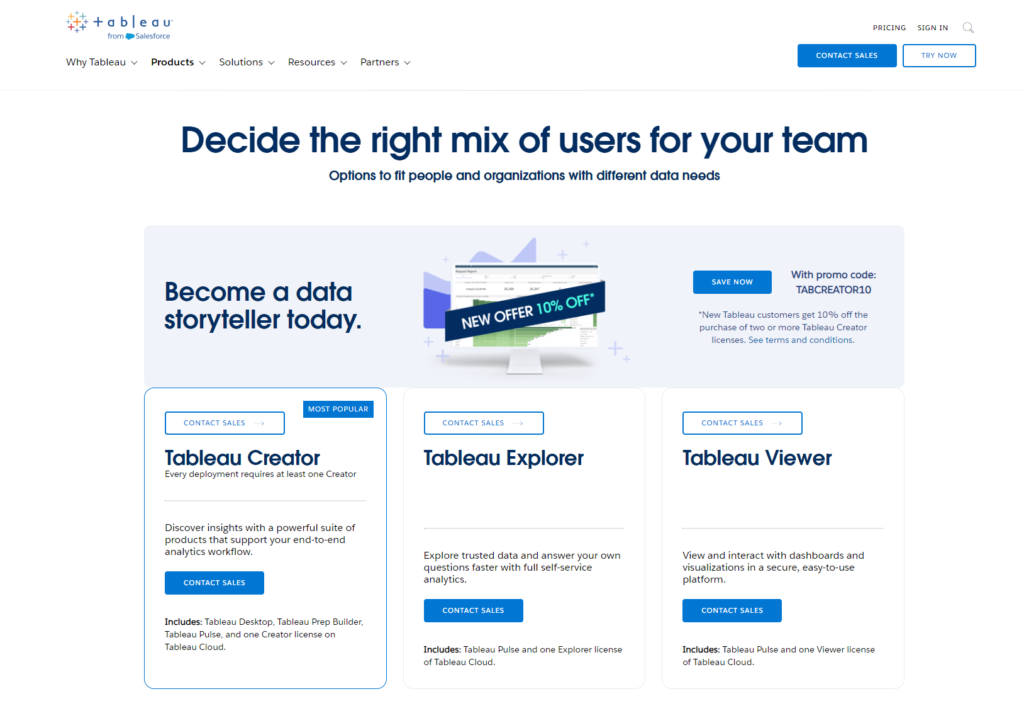
Tableau:
Conclusion
Concluding our exploration into Statcounter and Tableau reveals that both platforms serve distinct purposes in the analytics tool spectrum, tailored to meet different business needs.
Statcounter, with its straightforward approach, is ideally suited for small to medium-sized businesses, bloggers, and website owners focused on gaining immediate, understandable insights into web traffic and user behavior. Its affordability and ease of use make it an attractive option for those looking to monitor website performance without the need for extensive data analysis capabilities. Statcounter’s simplicity is its strength, allowing users to quickly implement it and begin tracking essential metrics, making it a practical choice for those with straightforward analytics needs or limited resources.
On the other hand, Tableau offers a robust solution for businesses seeking deep, comprehensive insights across multiple data sources. Its advanced visualization capabilities and extensive customization options cater to medium to large businesses or any organization requiring detailed analysis to inform complex decision-making processes. The investment in Tableau, both financial and in terms of learning curve, is justified by the powerful analytics capabilities it delivers, enabling businesses to uncover actionable insights that can drive strategic improvements.
Read Next:


Comments are closed.