
Choosing between Hotjar and Tableau can feel like deciding between a scalpel and a Swiss Army knife—both are tools designed for precision, but their strengths lie in different areas. In the vast expanse of the digital analytics universe, Hotjar shines as a tool laser-focused on understanding user behavior on websites through direct feedback and intuitive visualizations. Tableau, on the other hand, emerges as a powerhouse of business intelligence, transforming complex datasets into actionable insights across all areas of a business. If you’re at a crossroads, wondering which tool will best illuminate the path to data-driven decision-making for your business, you’re about to find clarity. Let’s embark on this journey together.
| Hotjar | Tableau |
|---|---|
 |  |
| G2 Score – 4.3 out of 5 stars | G2 Score – 4.4 out of 5 stars |
| TrustRadius Score – 8.2/10 | TrustRadius Score – 8.2/10 |
Data Visualization and User Interaction Insights
Hotjar: Simplifying Complex User Interactions into Actionable Insights
Hotjar’s approach to data visualization is fundamentally about demystifying user behavior on websites. By translating complex interactions into visual formats like heatmaps, session recordings, and feedback polls, it allows businesses to quickly grasp how users are engaging with their site. Heatmaps provide a color-coded representation of clicks, mouse movements, and scroll behavior, highlighting areas of interest and potential friction points. Session recordings offer a step-by-step replay of user journeys, providing context to the quantitative data and uncovering issues that might not be immediately apparent.
What sets Hotjar apart is its ability to integrate qualitative feedback directly into the visualization mix. Through polls and surveys, businesses can gather user feedback in real-time, adding a layer of insight that goes beyond what users do to why they do it. This blend of quantitative and qualitative data makes Hotjar an invaluable tool for businesses focused on optimizing the user experience. It simplifies the complex web of user interactions into actionable insights, guiding improvements that directly impact user satisfaction and business performance.
Tableau: Mastering the Art of Business Data Visualization
Tableau operates on a broader canvas, harnessing the power of data visualization to unravel complex business data across multiple domains. It’s not limited to website analytics but extends to any data set that can drive business intelligence. Tableau’s dashboards are a testament to its flexibility and depth, capable of integrating data from varied sources into cohesive visual stories. Users can customize these dashboards extensively, applying filters, drilling down into data layers, and exploring different scenarios through interactive elements.
The strength of Tableau lies in its capacity to transform raw data into insightful visual narratives that inform strategic decision-making. From sales performance and market trends to operational efficiencies, Tableau provides a comprehensive view of the business landscape. Its advanced analytics capabilities, such as predictive modeling and statistical analysis, further enrich these narratives, enabling businesses to not just understand their current state but also forecast future scenarios.
Integration Capabilities and Ecosystem Compatibility
Hotjar: Streamlining User Experience Insights
Hotjar is designed to integrate effortlessly with a wide range of platforms, making it a flexible addition to any digital ecosystem. Its primary focus on website analytics means it offers out-of-the-box integrations with popular content management systems (CMS) like WordPress, Shopify, and Magento, enabling businesses to quickly set up and start collecting user behavior data. Additionally, Hotjar can connect with other digital marketing and analytics tools, allowing for a holistic view of user engagement across different channels.
The value of Hotjar’s integrations lies in the ability to enrich the user experience insights it provides with data from other sources. For instance, integrating Hotjar with an e-commerce platform can offer deeper insights into how website interactions contribute to conversion rates, highlighting areas for improvement directly linked to revenue. This level of compatibility ensures that Hotjar can play a central role in a unified analytics strategy focused on optimizing the digital user experience.
Tableau: A Hub for Business Intelligence
Tableau, on the other hand, excels in its ability to integrate with a vast array of data sources, from simple spreadsheets to complex databases and cloud services. This flexibility is at the heart of Tableau’s utility as a business intelligence tool, allowing it to serve as a central hub for data analysis across an organization. The platform’s powerful data connectors and API enable businesses to create a seamless flow of data between Tableau and other systems, ensuring that all analytics are based on comprehensive, up-to-date information.
The strength of Tableau’s integration capabilities extends beyond data sources to include embedding analytics into other business applications. This means that the insights generated in Tableau can be directly accessed within CRM systems, custom applications, or even shared through external portals, making data-driven decision-making accessible across the entire organization. For businesses that rely on a diverse set of tools and platforms, Tableau’s robust integration options support a cohesive, data-centric approach to business strategy.
User Training and Educational Resources
Empowering Users for Maximum Impact
Hotjar: Facilitating User Experience Mastery
Hotjar places a strong emphasis on user education, offering an array of resources designed to help users get the most out of its suite of tools. Recognizing that its platform is often used by teams with varying levels of experience in analytics, Hotjar provides a comprehensive knowledge base, complete with articles, guides, and tutorials that cover both basic and advanced features. These resources are designed to be accessible and to empower users to conduct meaningful analysis of user behavior on their websites.
Additionally, Hotjar hosts webinars and case studies, showcasing best practices and successful use cases that can inspire and educate businesses about innovative ways to leverage Hotjar for enhancing website user experience. This approach not only helps users get up to speed with the tool but also fosters a community of learning, where businesses can share insights and strategies for optimizing online interactions.
Tableau: Building Data Analytics Expertise
Tableau offers an extensive array of educational resources aimed at users of all skill levels, from beginners in data visualization to advanced data analysts. The platform’s training resources include online tutorials, training videos, and interactive learning paths that guide users through the functionalities and capabilities of Tableau. These resources are part of Tableau’s commitment to building a data-literate world, equipping users with the knowledge they need to transform data into impactful business insights.
Beyond self-guided learning, Tableau also offers live training sessions and certification programs for users looking to validate their skills and expertise in data analysis and visualization. The Tableau Community provides a vibrant space for users to ask questions, exchange knowledge, and explore creative uses of Tableau, further enriching the learning experience. This robust support system ensures that businesses can fully leverage Tableau’s powerful analytics capabilities.

Related: Check out our free SEO suite

Reporting and Dashboard Capabilities
Visualizing Success
Hotjar: Intuitive Reporting for User Behavior Insights
Hotjar focuses on providing an intuitive and immediate understanding of user behavior through its reporting features. The platform simplifies the analytics process with visual reports that are easily digestible and actionable. Heatmaps, session recordings, and feedback analysis are presented in a user-friendly manner, allowing teams to quickly identify user experience improvements. This simplicity in reporting is a testament to Hotjar’s commitment to making user behavior insights accessible to a broad audience, including those without extensive data analysis experience.
The visual nature of Hotjar’s reports, particularly heatmaps and session replays, offers a unique lens into how users interact with a website, highlighting issues and opportunities that might not be evident through traditional analytics. The feedback tools further enrich these reports by providing direct user insights, making it easier for businesses to prioritize changes that will have the most significant impact on user satisfaction and conversion rates.
Tableau: Comprehensive Dashboards for In-depth Analysis
Tableau takes reporting and dashboard capabilities to another level, catering to businesses that require deep dives into complex datasets. Its powerful and customizable dashboards allow for the integration of data from multiple sources, offering a holistic view of an organization’s operations. Users can tailor these dashboards extensively, incorporating a wide range of visualization types and interactive elements to explore data from various angles. This customization is crucial for businesses that rely on detailed analytics to inform strategic decisions across different departments.
Tableau’s strength lies in its ability to not just present data, but to facilitate exploration and discovery, encouraging users to ask new questions and uncover insights that can drive innovation and growth. The platform supports a level of granularity and sophistication in data analysis that is unmatched, making it an indispensable tool for data analysts and business intelligence professionals looking to leverage data for competitive advantage.
Pricing and Accessibility
Balancing Cost with Value
Hotjar: Affordable User Behavior Analytics
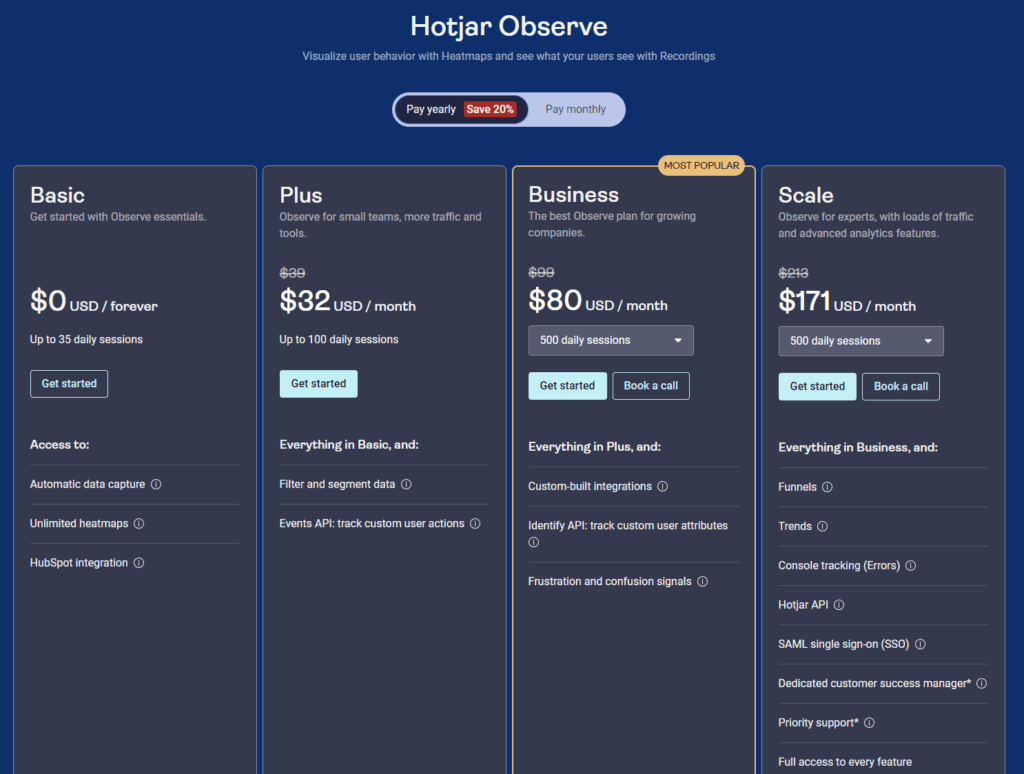
Hotjar is recognized for its straightforward and accessible pricing model, designed to accommodate businesses of all sizes—from small startups to large enterprises. Offering a range of plans, including a basic free version with limited features, Hotjar makes it possible for businesses on a tight budget to start gathering valuable insights into user behavior without a significant upfront investment. Paid plans are tiered based on the volume of data and the suite of features required, allowing businesses to scale their use of the tool as they grow.
This tiered pricing model, combined with Hotjar’s focus on user experience insights, makes it particularly appealing to businesses that prioritize direct feedback and visual analytics. The platform’s accessibility extends beyond pricing to its user interface, which is designed for simplicity and ease of use, ensuring that businesses can quickly derive value from their analytics efforts without needing specialized expertise.
Tableau: Comprehensive Business Intelligence at a Premium
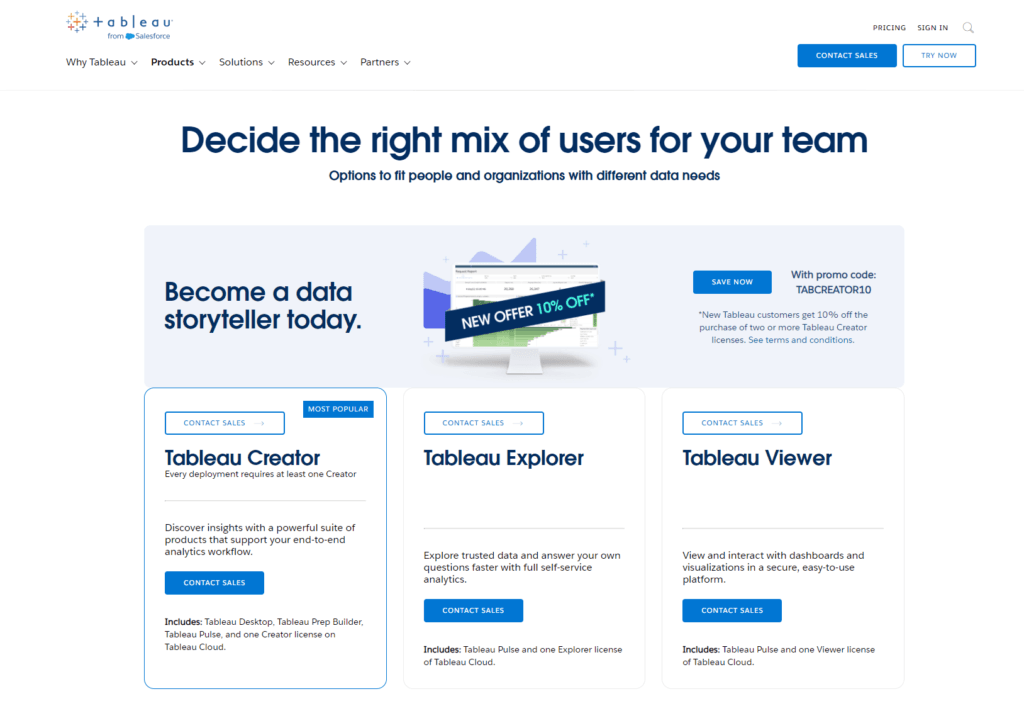
Tableau, positioned as a comprehensive business intelligence solution, offers a more complex pricing structure that reflects its wide-ranging capabilities. The platform is available in different editions, each catering to varying analytics needs, from individual use to deployment across large organizations. Pricing for Tableau is generally higher than Hotjar, aligning with its extensive data analysis and visualization features designed for in-depth business intelligence.
The investment in Tableau is justified by its powerful analytics engine and the breadth of data it can process, making it a valuable tool for businesses that require detailed analysis across multiple data sources. Tableau’s pricing and accessibility might present a steeper entry point, but for organizations with the resources to leverage its full suite of features, it offers a return on investment in the form of actionable insights that can drive strategic decision-making and competitive advantage.
Conclusion
Hotjar shines as a tool designed to bring you closer to your website’s visitors, offering direct insights into user behavior and feedback with an emphasis on improving the user experience. Its approachability, combined with powerful visualization tools and a commitment to privacy and compliance, makes it an ideal choice for businesses focused on enhancing website engagement and conversion.
Tableau, on the other hand, stands as a comprehensive business intelligence solution, adept at transforming complex datasets across various business functions into actionable insights. With its robust integration options, extensive educational resources, and advanced data analysis capabilities, Tableau is suited for organizations looking to leverage data at a strategic level, supporting informed decision-making across all areas of operation.
Read Next:
- What is Porter’s Five Forces Model (Important for Startup Growth)
- Legal Troubles for Platform Business Models
- What is a Business Model? And, How Yours Can be Revolutionary
- Business Going Bankrupt? Here’s What You Should Do (Indian Insolvency Law)
- 31+ Top Social Media Management tools Compared! (2023)


Comments are closed.