WinSavvy Editorial Standards
How this article was created
In the bustling arena of data analytics, where insights and clarity propel businesses forward, the quest for the perfect analytics tool can be daunting. Today, we navigate the waters between two formidable contenders: Tableau and Baremetrics. Each platform brings its unique strengths to the table, but how do they stack up when it comes to usability and the journey from novice to expert? Our exploration begins with a dive into Ease of Use and Learning Curve, a crucial battleground for any software vying for a spot in your tech stack.
| Tableau | Baremetrics |
|---|---|
| G2 Score – 4.4 out of 5 stars | G2 Score – 4.6 out of 5 stars |
| TrustRadius Score – 8.2/10 | TrustRadius Score – 10/10 |
Ease of Use and Learning Curve

The initial embrace of an analytics tool can significantly shape your relationship with data. An intuitive, user-friendly platform can turn data analysis from a dreaded chore into a delightful discovery process, unlocking actionable insights with ease.
Tableau: The Powerhouse of Possibilities

Tableau is celebrated for its robust capabilities, offering a versatile playground for data enthusiasts to explore, visualize, and share insights. However, this power comes with a learning curve. New users might find the array of features and customization options overwhelming at first glance.
Yet, Tableau softens this introduction with extensive resources: tutorials, forums, and live training are readily available, guiding users from basic operations to advanced data storytelling techniques. The journey with Tableau, while requiring some investment in learning, promises a rich reward of deep, actionable insights across a spectrum of data complexities.
Baremetrics: Streamlined Simplicity for Subscription Data

Baremetrics stands on the other side of the spectrum, offering a specialized, streamlined experience designed with subscription-based businesses in mind. The platform shines in its simplicity and focus, presenting key metrics like MRR, churn rate, and customer lifetime value with minimal setup.
Baremetrics prides itself on being immediately accessible, with a shallow learning curve that invites users to dive straight into their data. This focus on subscription analytics, while narrowing its use case, ensures that relevant insights are never more than a few clicks away, making it an attractive option for businesses looking for clarity and speed in their analytics journey.
Integration and Data Management

This area is pivotal as the capability to effortlessly bring together data from various sources into a cohesive and comprehensible format can significantly enhance the value derived from an analytics platform.
The modern business landscape is awash with data from a multitude of channels, making the integration capabilities of an analytics tool a key factor in its effectiveness. Additionally, how the tool manages, processes, and maintains the integrity of this data is equally critical for producing reliable insights.
Tableau: A Symphony of Data Sources

Tableau’s prowess in integrating with a wide range of data sources is one of its standout features. From databases and spreadsheets to cloud services and big data platforms, Tableau acts as a versatile conduit for data, bringing disparate sources together with ease.
Beyond mere integration, Tableau offers robust data management capabilities, including data cleaning, transformation, and preparation features that ensure data is not only accessible but also analysis-ready. This comprehensive approach allows businesses to harness the full potential of their data, fostering a culture of informed decision-making across all levels of the organization.
Baremetrics: Streamlined Focus on Subscription Analytics
Baremetrics differentiates itself by offering a focused integration experience, specifically tailored for subscription businesses. It directly connects with popular payment processing platforms such as Stripe, PayPal, and Chargebee, automating the collection of crucial subscription metrics.
This streamlined approach eliminates the need for extensive data manipulation, allowing businesses to immediately access, analyze, and understand their financial and customer data. While Baremetrics may not support the wide array of integrations that Tableau does, its targeted functionality ensures that subscription-based businesses can quickly glean insights without the complexity of handling diverse data types.
User Engagement and Adoption

The best analytics tool is only as good as its utilization across an organization. Engagement and adoption are pivotal, as they reflect the tool’s alignment with the users’ needs and its overall impact on the business.
A tool’s design, ease of use, and alignment with business objectives directly influence how willingly team members integrate it into their daily workflows. High engagement and adoption rates are indicative of a tool that not only meets but exceeds user expectations, fostering a data-driven culture within the organization.
Tableau: Catalyzing a Data-Driven Culture

Tableau is renowned for its ability to engage users with its intuitive interface and powerful visualization capabilities, making data analysis both accessible and enjoyable. Its broad community and extensive learning resources further support user adoption, offering guidance and inspiration to users at all skill levels.
Tableau’s versatility appeals to a wide audience within an organization, from data analysts to business executives, encouraging widespread use and fostering a collaborative, data-driven culture. The platform’s ability to adapt to various business needs and user preferences makes it a catalyst for enhancing data literacy and empowering decision-makers across the organization.
Baremetrics: Streamlining Analytics for Subscription Businesses
Baremetrics excels in engaging users by delivering precisely what subscription-based businesses need: straightforward, actionable insights into their financial and customer metrics. Its focused approach reduces the barrier to entry for users, particularly those without deep analytical backgrounds, making it easy to adopt and integrate into daily operations.
Baremetrics’ dashboard and reporting functionalities are designed to provide immediate value, encouraging regular use and making it an integral part of a subscription business’s strategy. By concentrating on essential metrics and simplifying the analytics process, Baremetrics ensures high adoption rates among its target audience, enabling these businesses to quickly leverage their data for growth.

Related: Check out our free SEO suite

Price and Accessibility

The pricing structure and the overall accessibility of an analytics tool can significantly influence its adoption within an organization. It’s not just about the initial cost but also the scalability of pricing as needs evolve and how readily teams can integrate the tool into their workflows.
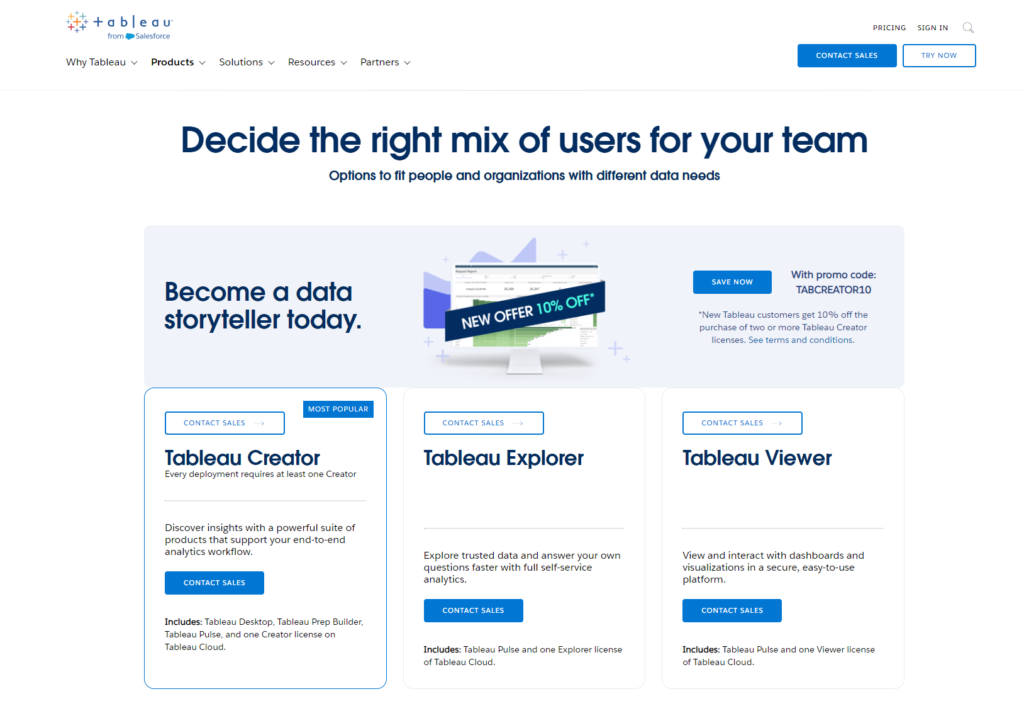
Tableau: Flexible Pricing with Broad Capabilities

Tableau offers a tiered pricing model that caters to individual users, teams, and entire organizations. This flexibility ensures that businesses of all sizes can find a plan that suits their budget while accessing Tableau’s comprehensive suite of analytics capabilities. The cost associated with Tableau can be substantial, particularly for larger deployments, but the investment is often justified by the depth and breadth of analysis that users can achieve.
Tableau’s pricing structure also accounts for scalability, allowing businesses to expand their use of the tool as their data analytics needs grow. Accessibility is another strong point for Tableau, with extensive documentation, a supportive community, and training resources making it easier for teams to onboard and leverage the platform effectively.
Baremetrics: Straightforward Pricing for Focused Analytics
Baremetrics stands out for its straightforward and transparent pricing, which is particularly appealing to small and medium-sized subscription-based businesses. The platform offers a simple, usage-based pricing model that scales with the size of the customer base and the volume of data processed. This approach ensures that businesses only pay for what they need, making Baremetrics an accessible option for companies looking to gain insights into their subscription metrics without a significant upfront investment.
While Baremetrics may not offer the same level of analytical depth as Tableau, its focus on subscription analytics means that it provides tailored insights that are immediately actionable, offering good value for businesses in its target market.
Customization and Reporting Capabilities

The ability to tailor reports and dashboards to fit specific business needs is a critical aspect of any analytics tool, impacting how insights are communicated and acted upon within an organization.
The extent to which an analytics platform allows for customization directly influences its utility and effectiveness. Customization encompasses everything from the visual appearance of reports and dashboards to the underlying data models and metrics used to generate insights.
Tableau: The Canvas of Infinite Possibilities

Tableau is often celebrated for its near-limitless customization capabilities, providing users with a rich canvas to paint their data stories. It empowers users to create complex, interactive dashboards and reports that can be tailored down to the minutest detail.
Whether it’s custom calculations, intricate data visualizations, or interactive filters, Tableau provides the tools necessary for users to convey their insights in the most impactful way. This level of customization makes Tableau not just a tool for data analysis but a powerful medium for storytelling, enabling businesses to communicate their insights compellingly and persuasively across various audiences.
Baremetrics: Focused Customization for Subscription Insights
Baremetrics, with its focused approach on subscription businesses, offers a different kind of customization experience. It emphasizes simplicity and clarity, providing pre-defined templates and metrics that are most relevant to subscription models, such as MRR, churn rate, and customer lifetime value.
While the scope for customization may not be as broad as Tableau’s, Baremetrics allows for sufficient tailoring within its niche, enabling businesses to highlight the metrics that matter most to them. This targeted approach ensures that subscription-based companies can quickly generate and share reports that drive decisions, without the need for extensive customization work.
Community and Ecosystem
A strong community and a rich ecosystem provide users with additional resources for learning, problem-solving, and extending the functionality of the analytics platform. They represent an invaluable asset for both novice and experienced users, facilitating knowledge exchange, innovation, and tool customization.
Tableau: A Vibrant and Expansive Community
Tableau boasts one of the most vibrant and engaged user communities in the data analytics space. Its community portal, Tableau Public, is a testament to this, offering a platform where users can share, explore, and discuss a wide range of data visualizations. The ecosystem around Tableau is equally impressive, featuring a wealth of plugins, extensions, and integrations developed both by Tableau itself and by third parties.
This extensive network not only enhances the platform’s capabilities but also provides users with endless opportunities for learning and growth. The Tableau Community Forums and the Tableau Conference further enrich the user experience, offering spaces for collaboration, education, and networking among data enthusiasts from around the globe.
Baremetrics: Targeted Support within a Niche Community
Baremetrics, while smaller in scale compared to Tableau, offers a focused community and ecosystem tailored to the needs of subscription-based businesses. The platform provides direct access to support and resources specifically designed for SaaS and subscription companies, facilitating a deep understanding of subscription metrics and business models.
Although the Baremetrics community may not offer the same breadth as Tableau’s, it stands out for its relevance and targeted support. Users can find a range of integrations specifically built to enhance subscription data analytics, and the Baremetrics blog and webinars provide additional value with insights and best practices tailored to the subscription economy.
Pricing
Tableau:
Baremetrics:

Conclusion
In wrapping up our thorough comparison of Tableau and Baremetrics, we’ve traversed significant terrain, from ease of use, integration capabilities, and customization options to scalability, support resources, and pricing models..
Tableau emerges as a comprehensive, versatile analytics tool, offering a depth of capabilities that cater to a broad spectrum of data analysis needs. Its robust integration options, extensive customization possibilities, and powerful scalability make it a formidable choice for organizations seeking a detailed understanding of their data across multiple dimensions. Coupled with a flexible pricing model and a wealth of learning resources, Tableau is designed to grow with your business, supporting a wide range of users from data novices to experts in cultivating a data-driven culture.
Baremetrics, on the other hand, presents a focused, streamlined solution particularly suited for subscription-based businesses. Its simplicity, clarity of insights, and straightforward pricing appeal to companies looking to quickly harness key metrics and financial data without the complexity of broader data analysis tools. Baremetrics excels in providing actionable insights that are essential for driving subscription growth and retention, making it an invaluable tool for marketing teams and decision-makers in the subscription economy.
Read Next:


Comments are closed.