WinSavvy Editorial Standards
How this article was created
Choosing the perfect analytics tool can feel a bit like finding a needle in a haystack. With so many options out there, it’s easy to get lost in the sea of features, benefits, and technical jargon. Today, we’re diving deep into a comparison that’s on many marketers’ and data analysts’ minds: Crazy Egg vs. Tableau. Whether you’re a small business owner, a digital marketer, or someone just looking to get a handle on your website’s performance, you’ve likely heard of these two giants in the analytics world. But which one is the right fit for you?
| Crazy Egg | Tableau |
|---|---|
| G2 Score – 4.2 out of 5 stars | G2 Score – 4.4 out of 5 stars |
| TrustRadius Score – 7.6/10 | TrustRadius Score – 8.2/10 |
User Interface and Ease of Use

In the world of analytics tools, user interface (UI) and ease of use are more than just fancy terms – they’re the bread and butter of your daily interaction with the software. Let’s face it; no one wants to spend hours on end trying to decipher cryptic graphs or navigate through a maze of menus. You want clear, actionable insights, and you want them now. This is where Crazy Egg and Tableau start to show their colors.
Crazy Egg:

Designed with simplicity in mind, Crazy Egg is a dream come true for non-technical users. If the thought of dealing with data makes you a bit queasy, Crazy Egg has got your back. From the moment you log in, you’re greeted with a clean, intuitive dashboard that makes you feel like a data scientist, minus the years of schooling. Setting up your first heatmap? A breeze. Want to understand what’s making your visitors click? The visual reports are so straightforward, you might just find yourself looking forward to your data analysis sessions.
The standout feature of Crazy Egg is its focus on visual analytics. Heatmaps, scroll maps, and confetti reports turn what would be complex data points into visually engaging, easily digestible information. This emphasis on visual learning not only makes it easier to understand what’s happening on your website but also makes sharing insights across teams a piece of cake. When it comes to onboarding and daily use, Crazy Egg’s simplicity ensures that you spend less time grappling with the tool and more time implementing insights.
Tableau:

On the other side of the spectrum, Tableau is the heavyweight champion of data analytics. It’s robust, powerful, and can handle just about any data visualization task you throw at it. But with great power comes great complexity. Tableau’s UI is dense, packed with features that can make your head spin if you’re not prepared. For data analysts and those comfortable with diving deep into numbers, Tableau is akin to a Swiss Army knife – incredibly versatile and efficient.
However, this complexity can be a double-edged sword. New users might find Tableau’s steep learning curve a bit intimidating. It’s not uncommon to spend a significant amount of time just getting familiar with the basics. But once you get the hang of it, the level of detail and customization available is unparalleled. You can slice and dice your data in ways that Crazy Egg can’t match, from detailed trend analyses to predictive modeling. For businesses with a dedicated data analysis team or those with a strong data-driven culture, Tableau’s depth and flexibility are unbeatable.
Data Integration and Sources

In today’s digital world, your data lives in a multitude of places. From social media interactions and email marketing campaigns to website analytics and customer relationship management (CRM) systems, the challenge isn’t just analyzing data; it’s bringing all that data together. Let’s see how Crazy Egg and Tableau stack up when it comes to data integration and sources.
Crazy Egg:

At its core, Crazy Egg is a tool focused on website analytics. It’s designed to give you a deeper understanding of your website visitors’ behavior through heatmaps, scroll maps, and other visual reports. This focus means that Crazy Egg excels at what it does, providing insights into user engagement, hotspots on your pages, and areas that might be causing confusion or drop-offs. However, this specialization also means that Crazy Egg’s capabilities for integrating external data sources are limited.
Crazy Egg’s primary data collection method is straightforward: you add a piece of JavaScript to your website, and it starts tracking visitor behavior. While this simplicity is great for its intended purpose, it does mean that if you’re looking to combine website behavior data with other data sources (like sales data, customer feedback, or social media engagement), you’ll likely need to export data from Crazy Egg and combine it manually with other datasets in a separate tool.
Tableau:

This is where Tableau starts to flex its muscles. Tableau was built with data integration in mind, capable of connecting to virtually any data source you can think of. Whether it’s live databases, cloud services, or Excel spreadsheets, Tableau can handle it. This capability makes Tableau an incredibly powerful tool for comprehensive data analysis across multiple facets of your business.
With Tableau, you can pull in data from your CRM to see how website engagement translates into leads, merge it with sales data to track conversion rates, or integrate social media analytics to get a full picture of your online presence. The beauty of Tableau lies in its ability to blend these diverse data sources seamlessly, allowing for a level of analysis that’s both deep and wide. You can create dashboards that not only track website analytics but also incorporate broader business metrics, providing a 360-degree view of your operations.
Moreover, Tableau supports real-time data analysis, which is a game-changer for businesses operating in fast-paced environments. Being able to see how changes on your website affect user behavior or sales in real-time allows for agile decision-making and swift adjustments to your strategy.

Related: Check out our free SEO suite

Reporting and Data Visualization

In the realm of analytics, how data is presented can be just as important as the data itself. Clear, compelling reports and visualizations not only make insights more understandable but also more actionable. Let’s delve into how Crazy Egg and Tableau tackle reporting and data visualization, a crucial aspect for any analytics tool.
Crazy Egg:

Crazy Egg’s approach to reporting is all about accessibility and immediacy. The platform specializes in visual reports, such as heatmaps, scroll maps, confetti maps, and overlay reports, which intuitively display where users are clicking, how far they are scrolling, and what actions they are taking on your website. These types of visualizations make it incredibly easy for anyone, regardless of their data literacy level, to grasp complex user behavior patterns at a glance.
One of Crazy Egg’s strengths is its ability to turn abstract data into visually intuitive and engaging reports. This makes it not only easier for teams to understand what’s happening on their website but also facilitates more effective communication across different departments. Whether you’re presenting findings to your marketing team, your design team, or your CEO, Crazy Egg’s reports are designed to be shared and understood by all.
The simplicity of Crazy Egg’s visualizations, however, comes with a trade-off. The platform focuses on providing a specific set of visual reports tailored to website analytics, which means there is less flexibility for creating custom reports or digging into data with more complex analytical tools. For users primarily interested in improving their website’s user experience and conversion rates, this focus is a significant advantage. However, for those looking to perform more detailed data analysis or integrate multiple data sources into their reports, Crazy Egg’s capabilities may be limiting.
Tableau:
Tableau stands as a titan in the field of data visualization, offering unparalleled flexibility and power in creating custom reports and dashboards. Tableau’s strength lies in its ability to handle complex datasets and present them through highly customizable visualizations. Whether you’re looking to create interactive dashboards, complex scatter plots, or detailed geographical mappings, Tableau provides the tools to visualize data in almost any way imaginable.
Tableau’s reporting capabilities are designed to cater to a wide range of use cases, from detailed financial analysis and sales reporting to customer insights and market research. The platform allows users to drill down into the specifics of their data, explore different scenarios through “what-if” analyses, and even predict future trends with its advanced analytics features. This level of detail and flexibility makes Tableau an excellent choice for organizations that rely on data to drive decision-making across multiple departments.
However, Tableau’s advanced capabilities come with a complexity that can be daunting for new users. Creating detailed reports and dashboards in Tableau often requires a solid understanding of data analytics principles and the platform itself. For organizations with dedicated data analysis teams, this complexity is a worthy trade-off for the depth of insight Tableau offers. For smaller teams or individuals without specialized data skills, the learning curve may pose a challenge.
Customer Support and Community

In the world of software and online tools, having access to reliable customer support and a vibrant community can make a huge difference in your user experience. Whether you’re encountering a technical issue, looking for tips to maximize your tool’s potential, or simply want to stay updated on the latest features, the level of support and community engagement can greatly impact your satisfaction. Let’s compare how Crazy Egg and Tableau stack up in terms of customer support and community.
Crazy Egg:

Crazy Egg has built a reputation for providing user-friendly support tailored to the needs of small to medium-sized businesses and individual users. The platform offers a comprehensive help center with articles, guides, and tutorials designed to get you up and running smoothly. For more personalized support, Crazy Egg provides email-based customer service, ensuring that help is just a message away. While the platform doesn’t offer live chat or phone support, the quality and responsiveness of its email support have received positive feedback from users.
Beyond formal support channels, Crazy Egg benefits from a loyal user base that shares tips, best practices, and success stories across various online forums and social media platforms. This user-generated content can be a goldmine for new users looking to get the most out of the platform. However, the size of Crazy Egg’s community and the extent of its engagement can vary compared to larger platforms with a broader user base.
Tableau:
Tableau, with its wide-reaching influence in the world of data analysis, boasts an extensive support infrastructure and a highly active community. Tableau offers a range of support options, including a detailed knowledge base, user forums, training videos, and direct support through phone and email. The Tableau Community Forums are particularly noteworthy, providing a vibrant space for users to ask questions, share insights, and connect with other data enthusiasts. Whether you’re a beginner looking for advice on creating your first dashboard or an experienced user seeking advanced analytical techniques, the community forums are an invaluable resource.
Additionally, Tableau hosts a series of user groups and events, including the annual Tableau Conference, which brings together data professionals from around the world. These events offer unique opportunities for networking, learning, and sharing experiences, further enriching the Tableau user experience.
The platform’s commitment to education and empowerment is also evident in Tableau Public, a free version of the software that allows users to share and discover dashboards online. This initiative not only helps users hone their skills but also contributes to a culture of sharing and collaboration within the Tableau community.
Pricing

Crazy Egg:
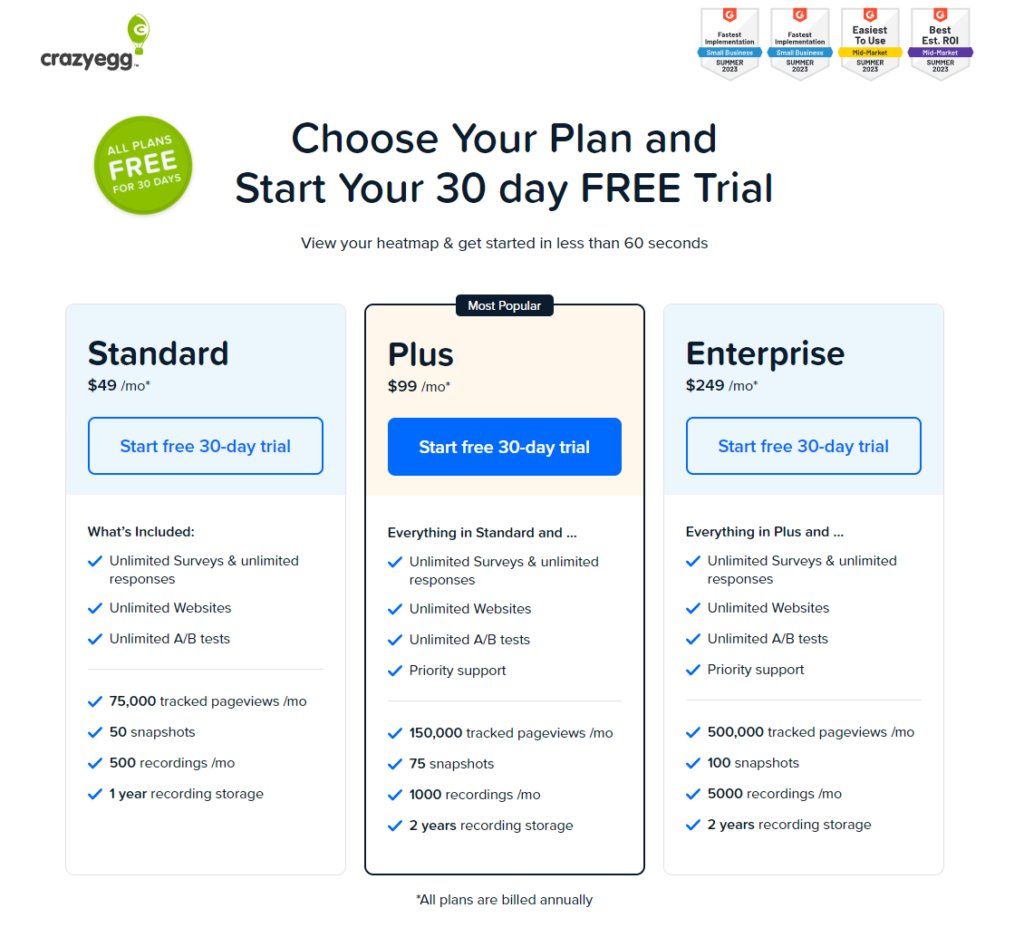
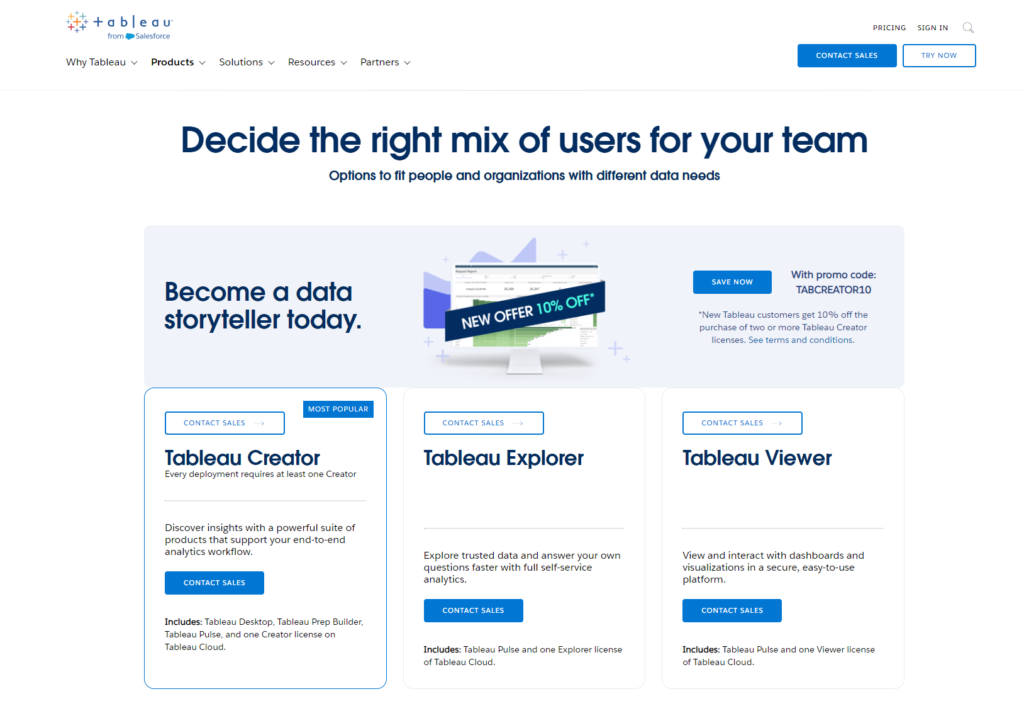
Tableau:
Conclusion
In wrapping up our detailed comparison between Crazy Egg and Tableau, it’s clear that both tools have their unique strengths and cater to different needs within the analytics landscape.
Crazy Egg shines as a user-friendly, intuitive tool focused on visualizing website user behavior. Its strength lies in its simplicity, making it an excellent choice for small to medium-sized businesses, marketers, and website owners looking to understand and improve their site’s user experience. With straightforward pricing, effective customer support, and a focus on visual analytics like heatmaps and scroll maps, Crazy Egg offers a specialized solution that’s accessible to those without a technical background.
Tableau, on the other hand, stands out as a powerful, versatile analytics platform capable of handling complex data analysis across various data sources. It’s designed for data professionals, analysts, and larger organizations that require in-depth insights into their operations. With its robust data integration capabilities, customizable reporting and visualization options, and a vibrant community, Tableau is the go-to choice for comprehensive data-driven decision-making. While it comes with a steeper learning curve and a higher cost, the investment can yield significant returns for those reliant on advanced analytics.
Read Next:


Comments are closed.