WinSavvy Editorial Standards
How this article was created
In the vast expanse of digital analytics tools, choosing the right platform can feel like navigating through a dense fog. On one side stands Statcounter, a beacon for those seeking straightforward, real-time insights into web traffic and user behavior. On the other side looms Looker, a robust platform offering deep data exploration and customized reporting for businesses hungry for data-driven decision-making. This guide aims to clear the mist, focusing initially on Data Visualization and Reporting Capabilities, a critical battleground where Statcounter and Looker showcase their distinct strengths.
| Statcounter | Looker |
|---|---|
| G2 Score – 4.3 out of 5 stars | G2 Score – 4.4 out of 5 stars |
| TrustRadius Score – 9/10 | TrustRadius Score – 8/10 |
Data Visualization and Reporting Capabilities
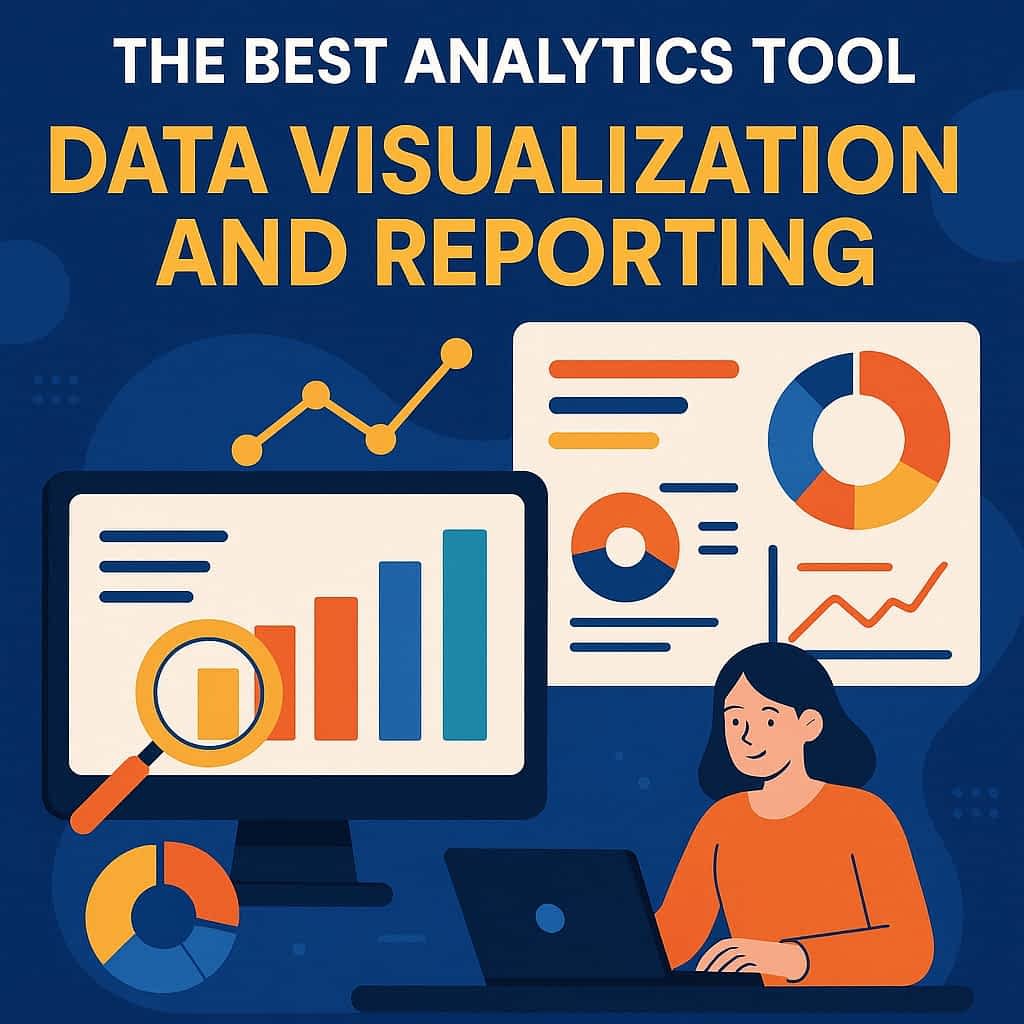
The power of an analytics tool is not just in the data it collects but in how it presents that data, transforming numbers into actionable insights through intuitive visualization and comprehensive reporting.
Statcounter: Clarity in Simplicity
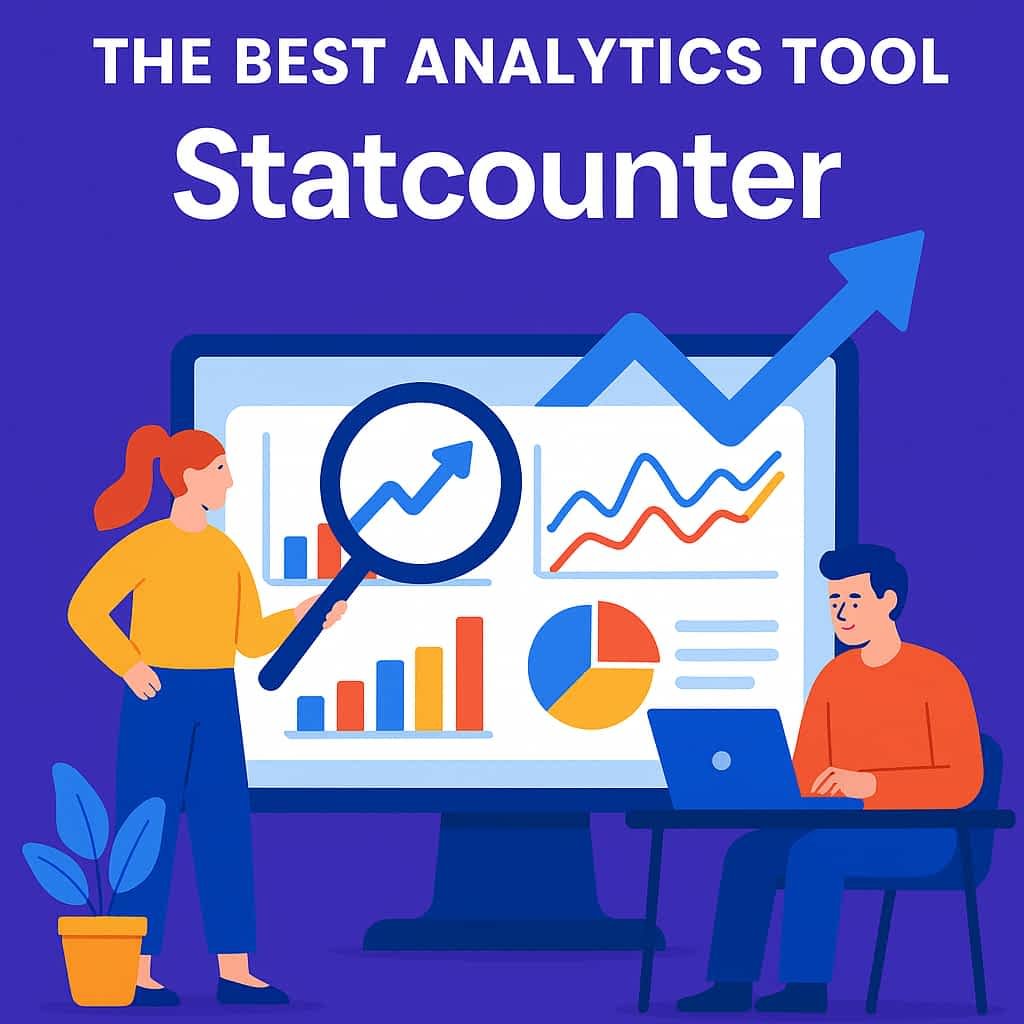
Statcounter excels in offering an uncluttered, user-friendly interface that provides immediate access to essential web analytics data. Its visualization capabilities, though not as extensive or customizable as more sophisticated platforms, present clear, straightforward charts and graphs that allow users to quickly grasp their website’s performance metrics. This simplicity is Statcounter’s strength, catering to small and medium-sized businesses or individuals who need quick insights without delving into complex data analysis. The platform’s reporting is focused on delivering key information, such as visitor numbers, page views, and session durations, in an easily digestible format.
Looker: Customizable Depth

Looker, in contrast, offers a powerful suite of data visualization and reporting tools designed for businesses that crave depth and customization in their analytics. It allows users to create highly detailed reports and dashboards that can be tailored to specific business needs, making it possible to uncover nuanced insights across a broad spectrum of data points. Looker’s strength lies in its ability to facilitate complex data exploration, supported by a wide range of visualization options that can accommodate everything from basic charts to intricate data models. This capability makes Looker an ideal choice for larger enterprises or businesses with sophisticated analytics requirements that go beyond web traffic statistics.
Data Visualization and Reporting Capabilities

When businesses deliberate between Statcounter and Looker, a pivotal aspect to consider is how each platform enables users to visualize data and generate reports. This capability is fundamental because it directly influences the ease with which teams can interpret data, uncover insights, and communicate findings to inform decision-making.
Statcounter’s Approach: Simplified Insight Generation

Statcounter focuses on providing straightforward, real-time web analytics, offering a series of predefined reports and basic data visualization tools that allow users to quickly grasp their website’s performance. This simplicity is beneficial for small to medium-sized businesses or individuals who require immediate insights without the need for complex analysis. Statcounter’s dashboards are designed to be intuitive, ensuring that even users with minimal analytics experience can navigate the platform and understand their web traffic data effortlessly. However, businesses looking for deep dives into data, custom reporting, or advanced visualization may find Statcounter’s capabilities somewhat limiting.
Looker’s Offering: Advanced Data Exploration

Looker, on the other hand, stands out for its powerful data visualization and reporting capabilities, built to serve the needs of businesses seeking comprehensive analytics solutions. Looker provides a highly customizable platform that allows users to create detailed reports and interactive dashboards tailored to specific business requirements. Its approach to data visualization emphasizes flexibility, enabling deep data exploration and the generation of actionable insights across various business functions. Looker’s capabilities support a wide range of data analysis, from basic metrics to complex predictive models, making it a preferred choice for enterprises and data-driven organizations that require granular analysis.
Ease of Implementation and Learning Curve

This aspect is crucial for businesses when considering the adoption of a new analytics tool, as it affects how quickly a team can become proficient in using the platform and start deriving actionable insights. The initial setup of an analytics tool and the learning curve associated with its use can significantly influence a business’s ability to effectively leverage the platform from the outset.
Statcounter: Quick Setup and User-Friendly Interface

Statcounter is designed with simplicity in mind, enabling a swift implementation process. Adding Statcounter to a website involves merely embedding a piece of code into the site’s HTML, a task that can be accomplished with minimal technical know-how. This ease of setup, combined with a user-friendly interface, means businesses can begin tracking website analytics almost immediately after installation. The platform’s straightforward design minimizes the learning curve, making it accessible even to those with limited experience in web analytics.
Looker: Comprehensive Integration with a Steeper Learning Curve

Looker, offering a more comprehensive analytics solution, requires a more involved setup process, particularly for businesses looking to take full advantage of its extensive customization and integration capabilities. Implementing Looker effectively often involves defining data models using LookML (Looker’s modeling language), a task that requires a certain level of expertise. Consequently, the learning curve for Looker can be steeper, as users must become familiar with its sophisticated features and functionalities to utilize the platform fully. However, the investment in learning and setup pays off through the deep insights and high degree of customization Looker provides, making it a powerful tool for data-driven businesses.

Related: Check out our free SEO suite

Customer Support and Community Resources

The level of support provided by an analytics platform, along with the resources available for learning and troubleshooting, can greatly impact user satisfaction and the overall effectiveness of the tool for a business. The accessibility and quality of customer support, along with an active community, can be pivotal for businesses relying on analytics tools to drive decision-making.
Statcounter: Direct and Accessible Support
Statcounter is known for providing direct and accessible customer support. Users can reach out through various channels, including email and a comprehensive FAQ section that covers a wide range of common issues and questions. This level of support is in line with Statcounter’s overall approach of simplicity, ensuring users can get quick answers to their queries without extensive delays. Additionally, while Statcounter may not have as large a community as some other analytics platforms, there is still a user base that shares insights and advice across forums and social media, providing a level of peer support.
Looker: Extensive Support and a Vibrant Community
Looker, as part of Google Cloud, offers extensive customer support options, including access to Google Cloud’s support infrastructure. This means businesses can benefit from a wide range of support services, from troubleshooting to strategic advice on utilizing Looker to its fullest potential. Additionally, Looker boasts a vibrant community of users, facilitated by dedicated community forums and user groups where members share tips, best practices, and solutions to common challenges. This community support is complemented by a wealth of documentation, tutorials, and learning resources, making it easier for businesses to onboard their teams and leverage advanced analytics capabilities.
Data Privacy and Compliance

In an era where data protection regulations are increasingly stringent, and consumer awareness about privacy is high, the capabilities of analytics tools to ensure compliance and protect user data are more critical than ever. How an analytics platform handles data privacy and navigates the complex landscape of global data protection regulations can significantly impact a business’s ability to use analytics tools confidently and responsibly.
Statcounter: Compliant with Fundamental Privacy Principles
Statcounter has taken steps to ensure that its platform complies with major data protection regulations such as the GDPR (General Data Protection Regulation) in the European Union and the CCPA (California Consumer Privacy Act) in the United States. This compliance is facilitated through features that allow website owners to anonymize IP addresses of their visitors and provide clear notices about the use of Statcounter analytics cookies. While Statcounter’s approach to privacy and compliance covers the basics, its straightforward analytics offering means it may not face the same level of complexity in data management and protection as more comprehensive analytics platforms.
Looker: Advanced Data Governance and Security
Looker, as part of the Google Cloud platform, benefits from Google’s robust data security and privacy infrastructure. It offers advanced data governance features that allow businesses to manage access controls, audit logs, and encryption both at rest and in transit, ensuring sensitive analytics data is securely handled. Moreover, Looker’s capabilities for handling data in accordance with global regulations are extensive, providing businesses with tools to comply with GDPR, CCPA, and other privacy laws. This includes features for data retention policies, consent management, and data subject access requests, making Looker an attractive option for businesses with stringent data privacy and compliance requirements.
Customization and Flexibility
This factor plays a significant role in how businesses can tailor the analytics platform to meet their specific needs, whether it’s for custom reporting, specific data analysis requirements, or integration with other tools. The degree to which an analytics tool allows customization can significantly impact its utility and effectiveness in delivering insights tailored to a business’s unique goals.
Statcounter: Simplified Customization for Core Needs
Statcounter offers a degree of customization that aligns well with its overall ethos of simplicity and ease of use. Users can customize their views and reports to some extent, focusing on the metrics that matter most to their business. This level of customization supports straightforward web analytics needs, allowing businesses to quickly adjust and react based on key performance indicators. However, for companies requiring more extensive customization—for instance, deeply customized dashboards or the ability to integrate complex datasets from multiple sources—Statcounter’s capabilities might be limiting.
Looker: Highly Customizable and Adaptable
Looker, in contrast, stands out for its high degree of customization and flexibility. The platform offers a powerful modeling language (LookML) that allows users to define precisely how their data is described and transformed, supporting the creation of complex data models that fit their specific analysis needs. Looker’s dashboards are highly customizable, not just in terms of appearance but also in how data is aggregated, filtered, and displayed. This flexibility extends to its integration capabilities, with Looker able to connect seamlessly with a wide array of data sources and third-party tools, enhancing its role as a comprehensive analytics solution within a business’s tech ecosystem.
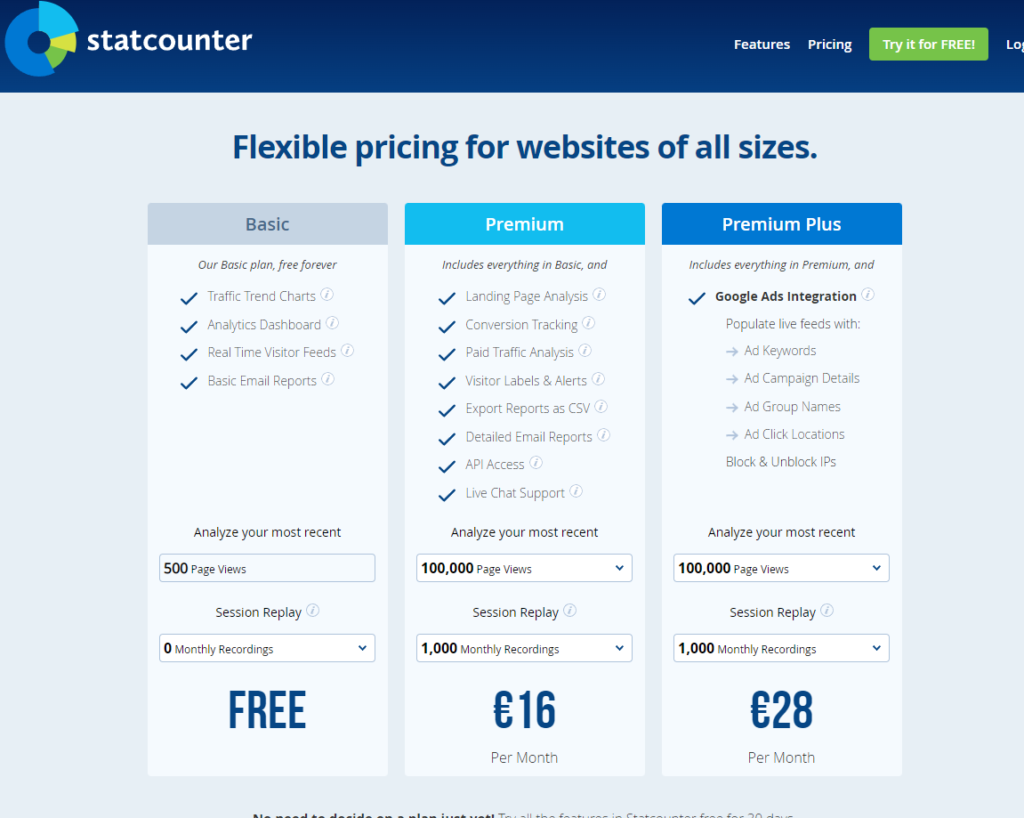
Pricing
Statcounter:
Looker:

Conclusion
In wrapping up our comparison between Statcounter and Looker, we’ve navigated through various critical aspects that differentiate these two analytics platforms. Each tool shines in its unique way, catering to distinct segments of the digital analytics market, with specific strengths that make them suitable for different business needs and operational scales.
Statcounter stands out for its simplicity, ease of use, and quick implementation, making it an ideal choice for small to medium-sized businesses or those new to web analytics. Its straightforward approach allows users to efficiently track basic web performance metrics and user behavior, providing immediate insights with minimal setup. Statcounter’s user-friendly interface and minimal learning curve make it accessible for businesses seeking essential analytics without the complexity or need for extensive technical resources.
Looker, on the other hand, offers a comprehensive analytics solution designed for in-depth data analysis, customization, and integration. Its robust platform caters to businesses looking for advanced analytics capabilities, including detailed data modeling, sophisticated reporting, and extensive integration with other tools and platforms. While Looker requires a more significant investment in terms of setup, learning, and possibly cost, it rewards businesses with deep insights, supporting data-driven decision-making and strategic planning across multiple facets of operations.
Read Next:


Comments are closed.