WinSavvy Editorial Standards
How this article was created
In the digital age, where every click holds a story and every user interaction can pivot a business strategy, choosing the right analytics tool is akin to selecting the perfect compass for a voyage across the vast seas of data. On one side, we have Mouseflow, a nimble and sharp-eyed navigator specializing in the intricacies of user behavior on websites. On the other, SAS Visual Analytics, a robust and comprehensive vessel designed to chart through the complex waters of enterprise data analytics. But which one is the beacon to guide you to your treasure trove of insights? Let’s embark on this journey with a closer look at their Integration Capabilities to see which tool might be the best mate for your data-driven voyage.
| Mouseflow | SAS Visual Analytics |
|---|---|
 |  |
| G2 Score -4.6 out of 5 | G2 Score -4.4 out of 5 |
| TrustRadius Score -9.9 out of 10 | TrustRadius Score -8.4 out of 10 |
Integration Capabilities: The Wind in Your Analytics Sails
The ability to seamlessly integrate with existing systems and data sources is not just a feature of an analytics tool; it’s the wind that propels the ship forward, ensuring that no insight is left marooned on an isolated data island. Here’s how Mouseflow and SAS Visual Analytics fare in harnessing this essential force.
Mouseflow: The Agile Explorer
Mouseflow is like a swift sloop, designed for specific missions—capturing and analyzing website user behavior with precision. Its strength lies in effortlessly integrating with a broad array of website platforms, including popular CMS like WordPress, eCommerce platforms like Shopify, and a range of other marketing and analytics tools.
This ease of integration enables businesses to quickly set sail on their journey to understand and optimize user experiences without getting entangled in the complex rigging of data systems. Mouseflow ensures that every interaction on your website, from clicks to scrolls, is mapped and analyzed, offering clear directions on how to improve the user journey.
SAS Visual Analytics: The Sturdy Galleon
In contrast, SAS Visual Analytics is a mighty galleon, built to navigate the deep and sometimes tumultuous waters of enterprise analytics. It boasts powerful integration capabilities that allow it to draw data from diverse sources, including cloud-based storage, on-premise databases, and external software applications.
SAS Visual Analytics is designed for organizations that require a holistic view of their operations, providing the tools to amalgamate data from various departments into a unified analytical dashboard. Its strength is not just in the volume of data it can process but in its ability to perform complex analyses, offering insights that can steer strategic business decisions across the entire organization.
User Experience and Dashboard Usability: Steering Through Data with Clarity
The design of an analytics platform’s interface and the intuitiveness of its dashboards act as the compass and maps for navigating the data seas. Here’s how Mouseflow and SAS Visual Analytics fare in making data exploration a smooth sailing experience.
Mouseflow: The Intuitive Pathfinder
Mouseflow, much like a nimble yacht designed for clear waters, offers a user experience focused on simplicity and direct insights. Its dashboard is crafted to present website analytics, such as heatmaps, session replays, and conversion funnels, in an accessible and easily understandable manner.
This ensures that even those with minimal analytics expertise can quickly gather insights into website user behavior, making informed decisions to optimize the user journey. Mouseflow’s emphasis on a user-friendly interface makes it an excellent tool for marketers, UX designers, and website owners who need to make swift adjustments based on user interaction data.
SAS Visual Analytics: The Commanding Navigator
SAS Visual Analytics, on the other hand, is like the command bridge of a large vessel, equipped with a broad array of instruments for navigating through complex data waters. It provides a powerful yet intricate dashboard experience, offering a wide range of customization options and advanced analytics features.
While SAS Visual Analytics delivers comprehensive insights across various business functions, it may present a steeper learning curve due to its complexity and the depth of analysis capabilities. However, for organizations with dedicated data analysts or those requiring detailed explorations across multiple data sources, SAS Visual Analytics’ dashboards offer the sophistication and flexibility needed to uncover strategic insights.
Pricing: The Cost of Setting Sail
The pricing structures for Mouseflow and SAS Visual Analytics reflect their distinct approaches and target markets, each designed to offer value to users at various stages of their analytics journey. Let’s explore the financial commitments required to embark with each platform.
Mouseflow: Favorable Winds for SMEs
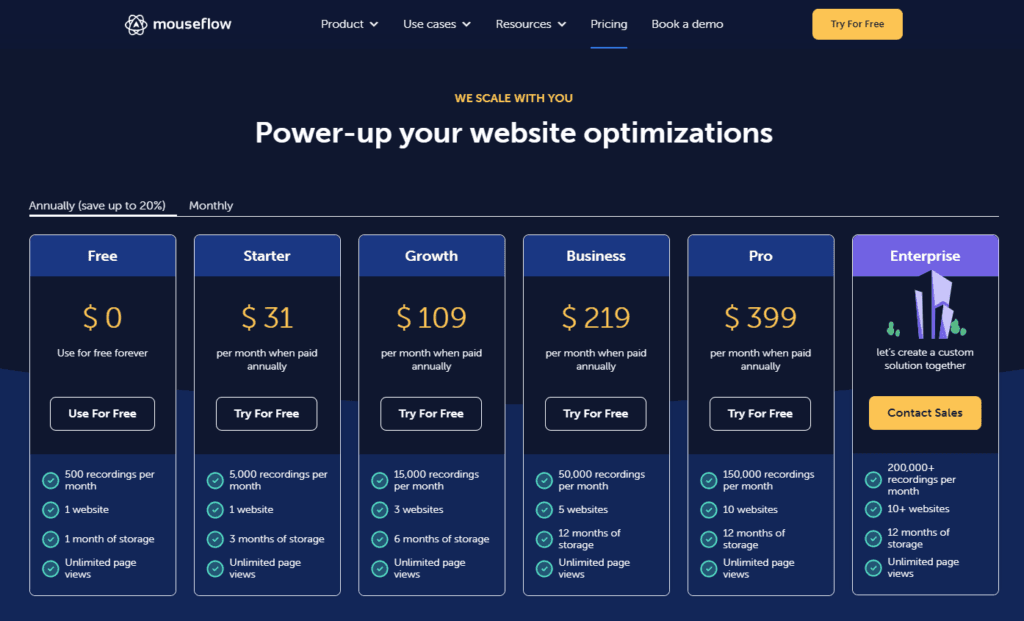
Mouseflow’s pricing is akin to favorable winds for small to medium-sized vessels, offering a range of plans designed to be accessible for businesses of all sizes.
With options spanning from a free plan for newcomers to the world of website analytics, up to more advanced packages for deep dives into user behavior, Mouseflow ensures that businesses can find a pricing tier that matches their needs without breaking the bank. Each tier increases in data collection capabilities, features, and support, allowing for scalability as a website’s traffic and analytical requirements grow.
SAS Visual Analytics: Charting a Course for Enterprises
SAS Visual Analytics, in contrast, sails a course tailored for the armada of large enterprises. Pricing for this platform tends to be bespoke, reflecting its positioning as a comprehensive, enterprise-grade analytics solution. Organizations interested in SAS Visual Analytics often need to engage directly with SAS to discuss their specific needs, data environments, and strategic goals to determine pricing.
This consultative approach ensures that the platform’s powerful analytics capabilities are matched with the organization’s requirements, offering a customized solution that, while potentially representing a significant investment, is poised to deliver considerable value across the enterprise.
Scalability and Performance: Ensuring Your Vessel is Seaworthy
The scalability of an analytics platform is a testament to its ability to adapt and grow with your business, handling increasing data volumes without compromising performance. Let’s assess how Mouseflow and SAS Visual Analytics stand up to the challenge of scalability and performance.
Mouseflow: Agile and Swift Across the Digital Waters
Mouseflow, much like a fast and agile vessel, is optimized for speed and efficiency in tracking website user behavior. It maintains performance and reliability as it captures detailed interactions across your site, regardless of traffic spikes or growing page numbers. This ensures that businesses can continue to gather comprehensive user data without experiencing slowdowns or loss of detail.
Mouseflow’s ability to scale with your website’s growth makes it an excellent choice for companies looking to maintain a seamless understanding of user engagement and experience.
SAS Visual Analytics: A Powerful Galleon in the Data Ocean
SAS Visual Analytics, on the other hand, is like a mighty galleon built to navigate the vast oceans of enterprise data. It shines in its ability to handle large datasets and complex analyses without compromising on speed or accuracy. The platform’s robust engine is designed for scalability, capable of serving large enterprises or businesses with extensive, multifaceted data environments.
With SAS Visual Analytics, organizations can perform deep, strategic analyses across various departments, leveraging the tool’s power to make informed decisions that drive business growth.

Related: Check out our free SEO suite

Data Security and Compliance: The Ship’s Bulwarks Against Stormy Seas
In the vast ocean of data analytics, robust security features and compliance with regulatory standards are critical for keeping your data treasures secure and your voyage lawful.
Mouseflow: Navigating with Precision and Care
Mouseflow, much like a nimble vessel designed for specific missions, places a strong emphasis on data privacy and security. It provides anonymization of user data to protect individual privacy while still capturing valuable insights into website interactions. Compliance with major data protection regulations, such as GDPR in Europe and CCPA in California, ensuring that businesses can sail confidently in compliance with privacy laws.
Secure data handling practices, including encryption of data in transit and at rest, acting as a sturdy hull against data leaks and breaches. Mouseflow’s approach to data security and compliance makes it a reliable choice for businesses focused on optimizing their website’s user experience without navigating the treacherous waters of non-compliance.
SAS Visual Analytics: A Fortified Galleon in the Data Seas
SAS Visual Analytics, on the other hand, is built like a fortified galleon, capable of weathering the harshest of data storms. It offers Robust data encryption and secure access controls, ensuring that sensitive business data is well-protected against unauthorized access and breaches. Compliance with a wide range of international and industry-specific data protection standards, enabling businesses to operate globally with confidence in their compliance posture.
Advanced data governance capabilities, allowing organizations to manage and monitor data access and usage effectively, ensuring compliance with internal policies and external regulations. SAS Visual Analytics’ comprehensive data security and compliance features make it a beacon of safety for enterprises navigating complex regulatory environments.
Customer Support and Learning Resources: Your Crew in the Analytics Journey
The availability and quality of customer support and educational resources can significantly impact how effectively a business can leverage an analytics platform, turning data into actionable insights.
Mouseflow: Guiding You Through User Analytics
Mouseflow, like a nimble vessel adept at coastal navigation, offers focused support tailored to its specialization in website analytics. Businesses can expect an extensive knowledge base filled with tutorials, guides, and FAQs designed to help users maximize the platform’s features for website optimization.
Webinars and training sessions that delve into specific aspects of Mouseflow’s capabilities, ensuring users can leverage every tool to understand and enhance user experience. Responsive customer support, available through email and chat, providing direct assistance for navigating any issues that arise during use. Mouseflow’s approach ensures that businesses looking to optimize their website’s user experience have a knowledgeable and accessible crew at their disposal, ready to help them navigate through the platform’s features and capabilities.
SAS Visual Analytics: Navigating Complex Data Seas
SAS Visual Analytics, akin to a large ship capable of long voyages across the open ocean, provides a comprehensive suite of support and learning resources suited for its enterprise-level analytics capabilities. Organizations can leverage a vast library of documentation, offering detailed guides on every aspect of the platform, from basic setup to advanced analytics techniques.
SAS training and certification programs, providing structured learning paths for users to deepen their expertise in analytics and data science. Dedicated customer support, including direct access to SAS experts for assistance with complex queries or issues, ensuring businesses can maintain smooth operations across their analytics endeavors.
For enterprises embarking on significant data analytics projects, SAS Visual Analytics offers a seasoned crew of experts and a treasure trove of resources to ensure their journey is both informed and supported at every step.
Conclusion
As our comparative exploration concludes, remember that the digital sea of data analytics is ever-expanding, with new technologies and methodologies emerging over the horizon. Whether your path aligns with the agile Mouseflow or the formidable SAS Visual Analytics, the key is to choose a tool that best aligns with your strategic objectives, empowering your organization to harness the winds of data and navigate confidently toward new horizons of success and discovery.
READ NEXT:
- Mouseflow vs QlikView: The Best Analytics Tool for You
- Mouseflow vs Oracle Analytics Cloud: The Best Analytics Tool for You
- IBM Cognos Analytics vs HubSpot Marketing Analytics: The Best Analytics Tool for You
- Hotjar vs Kissmetrics: The Best Analytics Tool for You
- IBM Cognos Analytics vs Tableau: The Best Analytics Tool for You
- 11 Marketing Analytics Tools to Elevate Your Data-Driven Strategies
- 29+ Digital Analytics Software to Skyrocket Your Digital ROI


Comments are closed.