WinSavvy Editorial Standards
How this article was created
Choosing between IBM Cognos Analytics and Tableau for your data analytics needs is like deciding between a Swiss Army knife and a specialized chef’s knife. Both are excellent tools, but each shines brightest in different scenarios. In the world of data analytics, where the right insights can propel your business forward, making an informed choice between these two powerhouses is crucial. So, grab a cup of coffee, and let’s embark on a journey to uncover which tool is the perfect fit for your data-driven aspirations.
| IBM Cognos Analytics | Tableau |
|---|---|
 |  |
| G2 Score – 4.0 out of 5 stars | G2 Score – 4.4 out of 5 stars |
| TrustRadius Score – 8.1/10 | TrustRadius Score – 8.2/10 |
Ease of Use and User Experience
When diving into data analytics, the last thing you want is to wrestle with a complicated interface or spend hours figuring out how to create a simple report. The ease of use and overall user experience are where IBM Cognos Analytics and Tableau begin to show their colors. Let’s peel back the layers and see what each tool brings to the table.
IBM Cognos Analytics: The Organized Workbench
IBM Cognos Analytics is built on the foundation of delivering a comprehensive, enterprise-level analytics experience. It achieves this by offering a structured and guided approach to data analysis, which is crucial for organizations looking to maintain consistency and accuracy across extensive reporting requirements. The platform’s interface is designed to facilitate a smooth navigation path for users, from data ingestion to insight generation.
This structured approach ensures that users, regardless of their technical expertise, can find the tools and functions they need without unnecessary complexity. However, this does not mean Cognos is simplistic; rather, it provides depth and sophistication within a framework that prioritizes clarity and order. Advanced users and IT professionals can delve into more complex functionalities, such as detailed data modeling and custom report development, making it a versatile tool that serves a wide range of analytics needs within an organization.
Tableau: The Artist’s Palette
In contrast, Tableau champions a more intuitive and interactive approach to data analytics, emphasizing the power of visual exploration. Its interface is renowned for being highly user-friendly, encouraging users to dive directly into data and start creating visualizations with minimal ramp-up time. The platform’s philosophy centers around the idea that data analysis should be an engaging, exploratory, and creative process.
Tableau achieves this by making data manipulation and visualization not just accessible but enjoyable for users of all skill levels. Its drag-and-drop functionality, combined with a wide array of visualization options, allows users to experiment with their data in real-time, fostering a sense of discovery and innovation. This emphasis on ease of use and engaging user experience has made Tableau a favorite among data analysts, business users, and decision-makers who appreciate the ability to quickly translate data into actionable insights.
Data Integration and Connectivity
The Backbone of Effective Analytics
IBM Cognos Analytics: Mastering the Data Deluge
IBM Cognos Analytics stands out for its robust approach to data integration and connectivity. It’s like a seasoned conductor, adept at orchestrating a symphony of data from disparate sources to create a harmonious analytical masterpiece. Cognos provides extensive support for a wide array of data sources, including relational databases, cloud data services, flat files, and even real-time data streams.
What sets Cognos apart is not just the breadth of its data source compatibility but also the depth of its integration capabilities. It offers sophisticated data modeling tools that allow you to transform raw data into a structured format suitable for complex analysis. This means you can blend data from different systems, enrich it with business logic, and ensure consistency across all your reports and dashboards. For organizations with complex data ecosystems, Cognos offers a comprehensive solution that can tame the data deluge and turn it into actionable insights.
Tableau: Making Connections Effortlessly
Tableau approaches data integration with a focus on user-friendliness and agility. Picture a nimble acrobat, effortlessly leaping between data platforms, bringing together diverse data sources into a cohesive analytical narrative. Tableau prides itself on its ability to connect to almost any data source, be it a database, a spreadsheet, or a cloud application, without requiring extensive setup or technical know-how.
The secret to Tableau’s seamless connectivity lies in its intuitive interface and drag-and-drop functionality, which extends to its data integration features. Users can quickly establish connections to their data, blend different sources, and start analyzing without being bogged down by technical details. This ease of use does not compromise the tool’s power—Tableau is capable of handling large datasets and complex data transformations, making it a versatile choice for businesses seeking both simplicity and depth in their analytics tool.

Related: Check out our free SEO suite

Customization and Flexibility
Tailoring Analytics to Fit Your Vision
IBM Cognos Analytics: A Structured Approach to Customization
IBM Cognos Analytics offers a highly structured approach to customization, emphasizing consistency, governance, and scalability. It provides a wide array of options for customizing reports, dashboards, and data visualizations, albeit within a framework that maintains data integrity and accuracy across the organization. This is particularly valuable for large enterprises that require a unified view of their data while catering to diverse departmental needs.
Cognos allows for the creation of highly detailed reports and dashboards that can be finely tuned to meet the specific requirements of different user groups within an organization. Advanced users can dive into the platform’s rich set of features to create complex data models and tailored analytical applications. However, this level of customization requires a good grasp of the platform’s capabilities and, often, a significant investment in training to fully leverage the potential of Cognos Analytics.
Tableau: Empowering Users with Agile Customization
Tableau takes a more agile approach to customization, empowering users with tools that encourage experimentation and creativity in data visualization. Its intuitive interface enables users to quickly modify visualizations, experiment with different data presentations, and adjust dashboards on the fly to uncover new insights. This flexibility is a cornerstone of Tableau’s appeal, especially for data analysts and business users looking to iteratively explore their data.
The platform’s drag-and-drop functionality extends to its customization features, making it accessible for users of all skill levels to create engaging, informative visualizations that tell compelling data stories. Tableau’s flexibility doesn’t stop at visual customization; it also offers a wide range of integrations with other tools and platforms, enhancing its adaptability to various workflows and user preferences.
Reporting Capabilities
Translating Data into Decisions
IBM Cognos Analytics: Comprehensive and Customizable Reporting
IBM Cognos Analytics stands out for its comprehensive reporting capabilities, designed to meet the needs of organizations that require detailed, customizable, and often complex reports. It offers a wide range of reporting features that cater to various user needs, from standard business reports to sophisticated analytical insights involving predictive analytics and trend analysis.
The strength of Cognos in reporting lies in its ability to handle large volumes of data across different sources, enabling users to create multi-dimensional reports that provide deep insights into business operations. The platform supports a high degree of customization, allowing users to tailor reports to specific organizational requirements. Users can define their own metrics, create custom visualizations, and even automate report distribution to ensure stakeholders receive relevant insights regularly.
Tableau: Interactive and Visual Reporting
Tableau revolutionizes reporting by emphasizing interactive and visual data presentation. It’s designed for users who seek to explore their data dynamically and share their findings through engaging, visually compelling reports. Tableau’s intuitive drag-and-drop interface makes it easy for users to create dashboards and reports that not only look great but are also interactive, allowing end-users to drill down into the details or view data from different perspectives with just a few clicks.
What sets Tableau apart in the reporting arena is its ability to make data accessible and understandable to a broad audience, regardless of their data literacy levels. Reports created in Tableau are not just static documents; they’re interactive tools that can help foster a more data-informed culture within an organization. This approach encourages exploration and discovery, making it easier for decision-makers to glean actionable insights from their data.
Collaboration and Sharing Capabilities
Fostering a Data-Driven Culture
IBM Cognos Analytics: Centralized Insights for Enterprise Collaboration
IBM Cognos Analytics is built with enterprise-level collaboration in mind, facilitating a centralized approach to sharing insights. The platform allows users to share reports and dashboards within a secure environment, ensuring that sensitive data is protected while still promoting data-driven decision-making across the organization. Collaboration in Cognos is about more than just sharing end products; it’s about enabling teams to work together on data exploration and report creation, providing a unified view of the data that supports cohesive strategic planning.
The platform also integrates with various enterprise communication tools, making it easier to disseminate insights across different departments and ensuring that critical information reaches the right stakeholders at the right time. This integrated approach to collaboration and sharing is designed to minimize silos and foster a culture where data is at the heart of every decision.
Tableau: Dynamic Sharing for Agile Teams
Tableau takes a slightly different approach to collaboration, one that emphasizes flexibility and user empowerment. The platform offers robust sharing and collaboration features that allow users to share dashboards and visualizations with ease, both within and outside the organization. Tableau’s interactive dashboards can be embedded in websites, shared via direct links, or even integrated into presentations, making it easy for users to disseminate insights in a dynamic, engaging format.
Moreover, Tableau promotes an interactive form of collaboration, where recipients can drill down into shared visualizations, explore the underlying data, and even create their own visualizations based on shared datasets. This approach not only makes collaboration more engaging but also empowers recipients by making them active participants in the analytical process.
Pricing and Cost-Effectiveness
Balancing Costs with Value
The pricing models of IBM Cognos Analytics and Tableau differ significantly, reflecting their distinct approaches to analytics. These differences can influence not only the upfront cost of adopting either platform but also the long-term financial impact on your organization.
IBM Cognos Analytics: Enterprise-Grade Investment
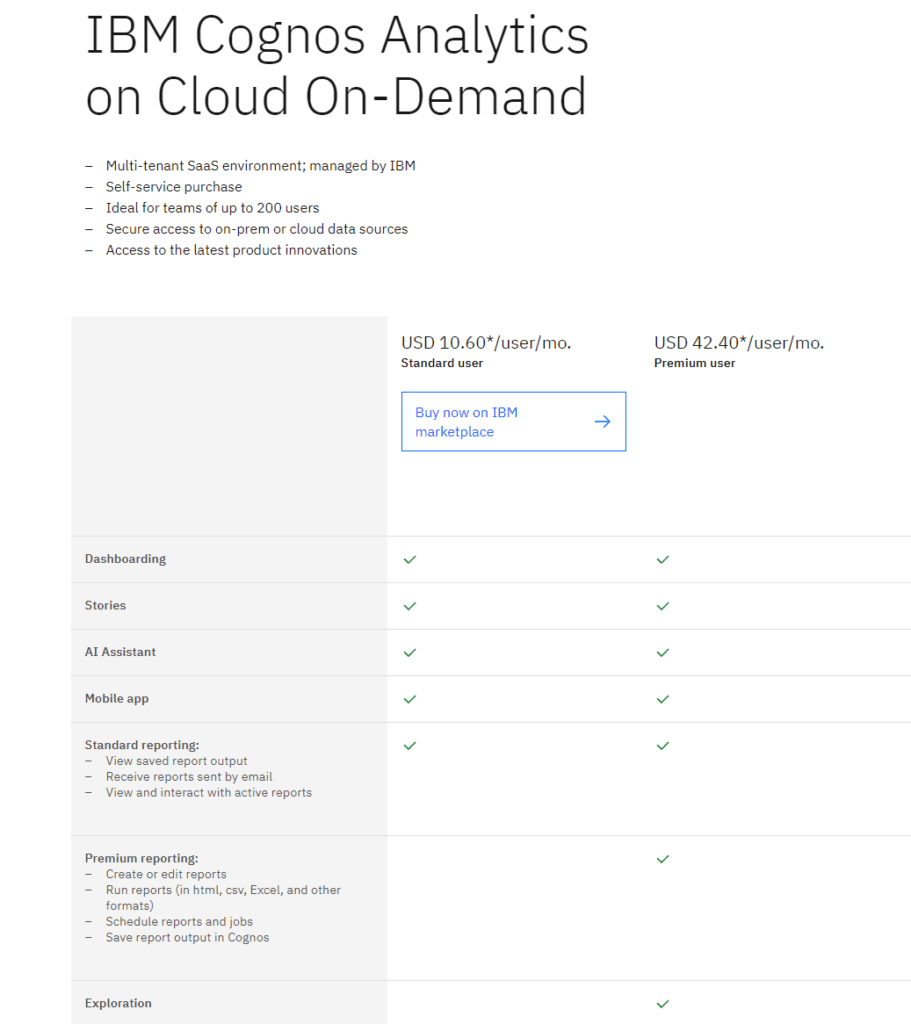
IBM Cognos Analytics is positioned as an enterprise-level solution, and its pricing model is structured to match. Typically offered through a tiered licensing approach, Cognos provides several packages that cater to different organizational needs and scales of deployment. The cost can vary based on factors such as the number of users, the level of functionality required, and whether the deployment is on-premises or cloud-based.
While the initial investment in IBM Cognos Analytics might be higher compared to some other analytics tools, it’s important to consider the comprehensive suite of features it offers. From advanced data modeling and governance capabilities to extensive customization options and robust security measures, Cognos is designed to serve as a holistic analytics platform that can satisfy a wide range of business intelligence needs across an organization. For large enterprises or businesses with complex analytics requirements, the value derived from Cognos can justify the investment, providing a powerful tool that supports informed decision-making at all levels.
Tableau: Flexible Pricing for Diverse Needs
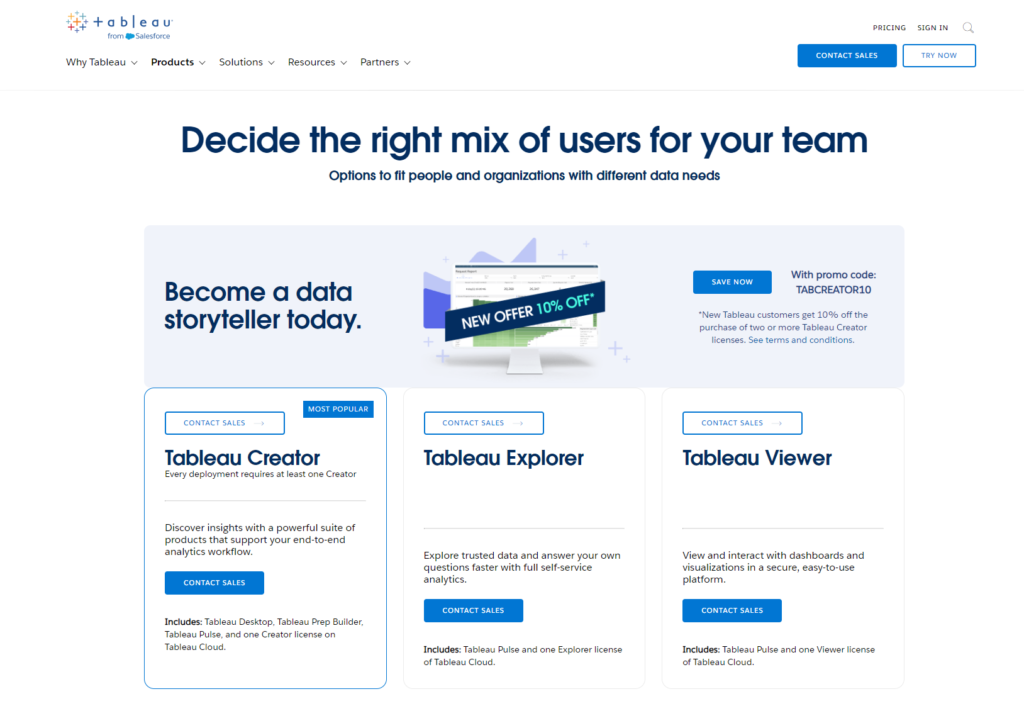
Tableau’s pricing model is known for its flexibility, designed to accommodate businesses of all sizes, from individual professionals to large corporations. Tableau offers a subscription-based pricing that varies depending on the specific products and the deployment options chosen (e.g., Tableau Desktop, Tableau Server, or Tableau Online). This model allows organizations to scale their use of Tableau according to their growth and evolving needs, adding or removing licenses as necessary.
One of the key attractions of Tableau’s pricing is the ability for users to start small and expand usage over time. This scalability makes Tableau an attractive option for medium-sized businesses and departments within larger organizations that are building their data analytics capabilities. The platform’s user-friendly interface and powerful visualization tools provide immediate value, enabling users to quickly generate insights and see a return on their investment. Furthermore, Tableau’s active user community and extensive resources for learning and support can enhance its cost-effectiveness, helping users maximize the platform’s capabilities.
Conclusion
IBM Cognos Analytics emerges as a robust, enterprise-grade solution, designed with the complexity and scale of large organizations in mind. Its structured approach to data analytics ensures consistency and governance across the board, making it an ideal choice for businesses that prioritize comprehensive data integration, extensive customization capabilities, and stringent security measures. The investment in Cognos Analytics is not just in the software itself but in a holistic analytics environment capable of supporting informed decision-making at all levels of the organization.
Tableau, on the other hand, is celebrated for its intuitive design and powerful visualization capabilities, making it a favorite among users seeking flexibility and ease of use in their analytics tools. With its ability to connect to a wide array of data sources and encourage exploratory data analysis, Tableau is perfectly suited for organizations and teams that value quick insights and the creative presentation of data. Its scalable pricing model further enhances its appeal, offering a path for businesses to grow their analytics capabilities in tandem with their evolving needs.
Read Next:
- Crafting Content for Voice Assistants: Meeting the Demand of Smart Homes
- Content Marketing for E-learning Platforms: Engaging Learners Effectively
- The Role of Analytics in Refining Your Content Strategy
- Content Marketing in Crisis Situations: Navigating Challenges with Sensitivity
- 31+ Top Social Media Management tools Compared! (2023)


Comments are closed.