
Welcome to this detailed explainer on Crazy Egg, one of the top tools in the world of Conversion Rate Optimization (CRO). As a startup founder or a digital business owner, you know that optimizing your website for conversions is vital for success. Let’s dive in and explore the plethora of features Crazy Egg offers and understand how to use them effectively.
Crazy Egg: An Overview
Crazy Egg is a web analytics tool that gives you a deeper understanding of your users’ interactions with your website. It uses heatmaps, scroll maps, A/B testing, and more to visualize what’s working and what isn’t on your site. But where Crazy Egg really shines is in its unique ability to show you what people are doing with their mouse movements and clicks on your pages. It’s like having X-ray vision for your website.
But to truly leverage the power of Crazy Egg, you need to understand how to use each of its features to the fullest. So let’s break them down one by one.
Heatmaps: Visualizing User Engagement
Crazy Egg’s heatmaps tool is your go-to feature for getting an overview of how users are interacting with your website.
How to Use Heatmaps
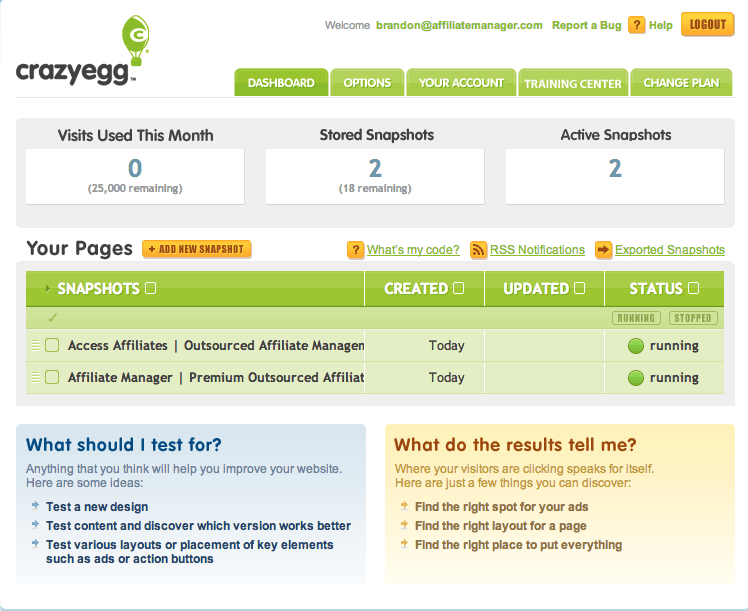
Once you’ve set up Crazy Egg on your site, go to the Crazy Egg dashboard and select the webpage you want to analyze. Under the ‘Heatmaps’ tab, you’ll see a visual representation of where users click and how they move their mouse on the page. You’ll see hotspots of activity and zones of inactivity, offering a quick way to identify potential issues with your website’s design.
Maximizing the Use of Heatmaps
When using heatmaps, consider the 21+ Design Elements that Make a Page High Converting. Are these elements getting the attention they should? If not, you might want to consider a redesign using the guidelines provided in this 7 Step Process to Redesign Your Website.
Scroll Maps: Discovering User Behavior
Scroll maps show you how far users are scrolling down your webpage. It’s an excellent tool for understanding the effectiveness of your content’s length and placement.
How to Use Scroll Maps
From your Crazy Egg dashboard, select ‘Scroll Maps’ for the webpage you want to analyze. You’ll see a color-coded representation of your page. Warmer colors (red, yellow) show where most users are scrolling and spending time, while cooler colors (blue, green) show areas less frequently seen by users.
Making the Most of Scroll Maps
Scroll maps can help you discover if essential elements or content are going unseen because they’re located too far down the page. For instance, if your call-to-action is in a cooler area, you might want to move it higher up to ensure more users see it. Avoid Web Design Features that Hurt Conversions by paying attention to what your scroll maps are telling you.
A/B Testing: Empowering Data-Driven Decisions
A/B testing is a method of comparing two versions of a webpage to see which one performs better. With Crazy Egg’s A/B testing feature, you can make informed decisions about what changes will improve your site’s performance.
How to Conduct A/B Tests
To start an A/B test, go to your Crazy Egg dashboard and select ‘A/B Tests.’ From there, you can choose the page you want to test and create a variant of it. Change the element you want to test on the variant page, whether it’s a headline, button color, image, or something else. After running the test for a sufficient time, you can compare the performance of both versions and choose the one that results in better conversions.
Leveraging A/B Testing for Optimal Results
The key to successful A/B testing is to test one element at a time. If you change multiple elements, it’s difficult to determine which change affected the results. Check out this Ultimate Guide on A/B Testing to better understand how to run effective tests.
User Recordings: Understanding User Journeys
User recordings in Crazy Egg let you see exactly how users are interacting with your website, giving you a wealth of qualitative data about user behavior.
Using User Recordings
Access user recordings from the Crazy Egg dashboard by selecting ‘User Recordings.’ You’ll see a list of recorded sessions you can watch. These recordings show exactly what users did during their visit, from mouse movements to clicks and scrolling.
Maximizing Insights from User Recordings
User recordings can offer you insights that can be used to improve your website’s usability. Comparing these insights with those from usability testing can provide a more holistic view of your website’s performance. Here’s a guide on How to Use Usability Testing to Boost Conversion Rates that can be beneficial.
Crazy Egg’s Reports and Integrations
Crazy Egg provides comprehensive reports to help you understand the data it collects. It also integrates with numerous other tools, making it a versatile addition to your tech stack.
How to Use Crazy Egg Reports
You can access reports from your Crazy Egg dashboard by selecting ‘Reports.’ These reports offer insights into aspects like the source of your website traffic, the performance of your A/B tests, user behavior on your website, and more.
Harnessing the Power of Integrations
Crazy Egg integrates with various tools, including Google Analytics and WordPress, allowing you to cross-reference your Crazy Egg data with data from other sources for a more comprehensive understanding of your site’s performance. Use this guide to compare marketing analytics tools to understand how Crazy Egg can work in conjunction with other tools.
In conclusion, Crazy Egg offers a suite of powerful tools for understanding and improving your website’s performance. By using these tools effectively, you can significantly optimize your website’s conversion rate, making it a vital tool in your CRO toolkit. Consider this Comparison of Top 51 Conversion Rate Optimization Software to see how Crazy Egg stacks up against the competition. Happy optimizing!
Read Next:
- How to Use Falcon.io: An Explainer
- Porter’s Five Forces Model: Explained!
- Laws that US Marketers Need to Be Aware of!