WinSavvy Editorial Standards
How this article was created
In the digital age, where data not only informs but drives business strategies, the quest for the perfect analytics tool can feel like a journey through a dense, uncharted jungle. Enter Segment and Tableau, two giants in the analytics world, each offering unique paths to the treasure trove of insights that lie hidden within your data. But which is the right guide for your expedition? Whether you’re a small startup looking to understand customer behavior or a large enterprise seeking to visualize complex data landscapes, making the right choice between Segment and Tableau could be the key to unlocking your business’s potential. Let’s embark on this exploration, starting with a crucial aspect of analytics: Data Integration and Management.
| Segment | Tableau |
|---|---|
| G2 Score – 4.6 out of 5 stars | G2 Score – 4.4 out of 5 stars |
| TrustRadius Score – 8.3/10 | TrustRadius Score – 8.2/10 |
Data Integration and Management

In the realm of analytics, the richness of insights you can extract is often directly proportional to the quality and comprehensiveness of your data integration and management capabilities. Here’s how Segment and Tableau compare in this vital area.
Segment:
Designed as a customer data platform, Segment specializes in collecting, unifying, and channeling your data from multiple sources into a single repository. Its primary strength lies in its ability to seamlessly integrate with a vast array of tools and systems—over 300 at last count—enabling you to consolidate disparate data streams for a unified view of your customer journey. This robust integration framework makes Segment particularly adept at handling complex data pipelines, ensuring that your analytics, marketing, and data warehousing tools are always fueled with high-quality, consistent data. For businesses looking to build a comprehensive data foundation that supports a wide range of analytics and marketing activities, Segment offers a powerful solution.
Tableau:
While Tableau is renowned for its advanced data visualization capabilities, it also offers strong data integration and management features. Tableau can connect to nearly any data source, from simple spreadsheets to complex databases, cloud services, and even real-time data streams, transforming raw data into actionable insights through its intuitive dashboards and reports. Unlike Segment, which focuses on data routing and unification, Tableau emphasizes the end-user experience, providing tools that allow users to interact with, analyze, and visualize data without needing extensive technical skills. This makes Tableau an excellent choice for organizations that prioritize data exploration and visualization across various skill levels.
Ease of Use and Learning Curve

The accessibility of an analytics tool, along with how quickly you and your team can become proficient in using it, plays a crucial role in its effectiveness and the speed at which you can start deriving actionable insights. Here’s how Segment and Tableau stack up in terms of user-friendliness and the learning curve associated with mastering them.
Segment:
Segment’s primary function as a customer data platform is to collect, unify, and send data to other analytics tools. While its backend operations can get complex, especially when setting up advanced integrations or managing large datasets, Segment has made significant strides in making the platform as user-friendly as possible. The interface for managing integrations and viewing data flows is straightforward, and Segment offers extensive documentation, tutorials, and support resources to help users navigate the platform. However, the initial setup and optimization might require a technical understanding of APIs and data schemas, presenting a steeper learning curve for those without a technical background.
Tableau:
Known for its powerful data visualization capabilities, Tableau is designed with the end-user in mind, offering a drag-and-drop interface that allows users to create complex visualizations without extensive coding knowledge. This emphasis on user experience extends to Tableau’s data connection process, which simplifies the integration of various data sources. Nevertheless, to fully leverage Tableau’s advanced visualization and analysis features, users will likely need to invest time in learning the platform. Tableau provides a wealth of learning resources, including guided training, forums, and user communities, to help mitigate this learning curve. For those dedicated to unlocking deep insights through data visualization, Tableau’s initial learning investment is often well worth the effort.

Related: Check out our free SEO suite

Customization and Flexibility

The degree to which you can customize an analytics tool and its flexibility in adapting to your business’s evolving needs are key factors in its long-term value. Here’s a closer look at how Segment and Tableau address customization and flexibility in their offerings.
Segment:
Segment’s platform is built around the concept of flexibility and customization. Its primary function as a customer data platform is to gather data from multiple sources, standardize it, and then route it to over 300 different tools and systems where it can be analyzed and actioned. This broad integration capability allows businesses to customize their data pipelines according to their specific needs, choosing which data to collect, how to process it, and where to send it for further analysis. Segment’s flexibility makes it an excellent choice for businesses with complex data ecosystems or those that anticipate needing to pivot their strategies as they grow and evolve.
Tableau:
While known for its powerful data visualization capabilities, Tableau also offers significant customization and flexibility in how data is analyzed and presented. Users can create custom dashboards and reports from virtually any data source, tailoring the visualizations to meet their specific business requirements. Tableau’s drag-and-drop interface allows for deep customization of charts and graphs, enabling users to explore data in highly nuanced ways. Additionally, Tableau’s ability to connect to a wide array of data sources and its extensive options for visual analytics make it a flexible tool that can adapt to various business needs and changes over time.
Industry Application and Use Cases

The utility of an analytics tool often shines brightest when viewed through the lens of specific industry needs and common use cases. Here’s how Segment and Tableau cater to different sectors and applications.
Segment:
With its robust data integration and management capabilities, Segment is particularly well-suited for industries where customer journey mapping and personalized marketing play critical roles. E-commerce, SaaS, and digital media stand out as sectors that can greatly benefit from Segment’s ability to unify customer data across multiple touchpoints and platforms. Use cases include improving customer segmentation for targeted marketing campaigns, optimizing the customer experience across devices and channels, and streamlining analytics workflows by centralizing data collection and distribution. For businesses in these industries, Segment’s platform can act as the foundational infrastructure for data-driven strategies, supporting a wide range of analytics and marketing tools.
Tableau:
Tableau’s strength in data visualization and analysis makes it a versatile tool across various industries, including finance, healthcare, education, and retail. Its ability to connect to virtually any data source and transform raw data into intuitive, interactive dashboards has broad applications. Financial institutions can use Tableau for risk assessment and portfolio management, healthcare organizations for patient data analysis and operational efficiency, educators for tracking student performance metrics, and retailers for sales forecasting and inventory management. Tableau’s flexibility in visual analytics supports a myriad of use cases, enabling businesses to extract and present actionable insights tailored to their specific industry challenges and goals.
Community Support and Resource Availability
The accessibility of external resources, such as community forums, user guides, and professional training, can significantly impact the effectiveness of any analytics tool by enhancing learning and problem-solving. Here’s a brief look at the support ecosystems for Segment and Tableau.
Segment:
As a pivotal player in the data integration space, Segment boasts a growing community of developers and marketers. While it may not have as vast a user base as some established analytics platforms, the quality of support through its official documentation, community forums, and knowledge base is high. Segment also benefits from an active developer community that contributes to third-party guides, SDKs, and integrations. The availability of professional services and support from Segment and its partners further ensures that businesses can maximize the platform’s value.
Tableau:
Tableau, recognized for its leading role in data visualization, has cultivated a large, passionate community. This community is a rich resource for new and experienced users alike, offering access to a wide range of tutorials, forums, user groups, and the annual Tableau Conference, which brings together data enthusiasts from around the globe. Tableau Public, a free platform that allows users to publish and share their visualizations, further exemplifies Tableau’s commitment to fostering a collaborative and supportive user ecosystem. The abundance of learning materials and community-generated content makes Tableau one of the most accessible and supported analytics platforms available.
Pricing and Value Proposition
Understanding the pricing structure and overall value proposition of Segment and Tableau is essential for making an informed decision that aligns with your budget constraints and analytics needs. Here’s how each platform stands in this regard.
Segment:
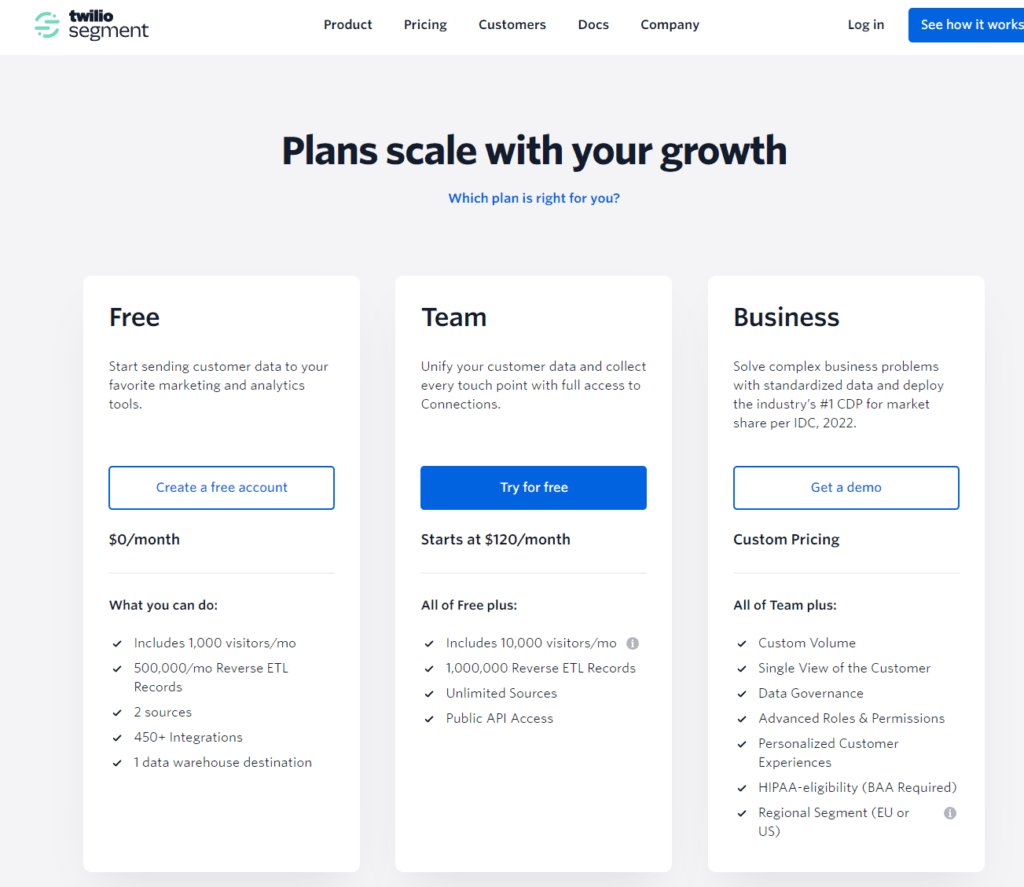
Segment operates on a tiered pricing model, which scales with the volume of data you’re tracking and the complexity of your integration needs. Starting with a free tier for basic data collection and limited integrations, Segment’s pricing increases as you require more advanced features, higher data volumes, and access to a wider range of integrations. The value proposition of Segment lies in its ability to serve as a comprehensive data infrastructure, simplifying the collection and routing of data across your entire stack. This consolidation can significantly reduce overheads related to managing multiple analytics integrations and ensure data consistency, offering a strong ROI for businesses with complex data needs or those looking to scale.
Tableau:
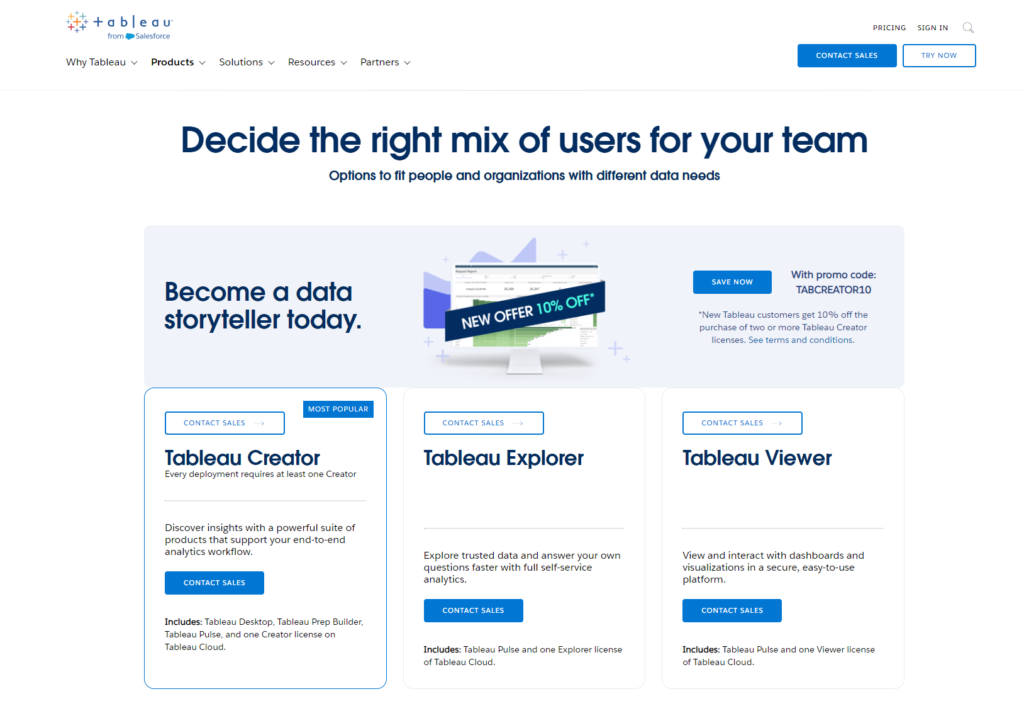
Tableau’s pricing is based on the number of users and the level of access required, with options ranging from viewing capabilities to full data preparation and analytics. Tableau offers both individual and server-based licenses, catering to different organizational needs and scales. The value proposition of Tableau centers on its powerful data visualization and exploration capabilities, enabling businesses to derive actionable insights through intuitive, interactive dashboards and reports. For organizations looking to democratize data analysis and foster a data-driven culture, Tableau’s investment can yield significant returns in the form of informed decision-making and enhanced business intelligence.
Conclusion
In wrapping up our exploration of Segment versus Tableau, it’s evident that both platforms offer distinct advantages, designed to meet different analytics needs and objectives. Your choice between the two should be guided by a thorough understanding of your specific requirements, the scale and complexity of your data, and the strategic goals of your business.
Segment excels as a customer data platform, offering robust data integration and management capabilities ideal for businesses looking to centralize and streamline their data collection from multiple sources. It’s particularly suited for organizations with complex digital ecosystems, aiming to build a comprehensive view of the customer journey across various touchpoints. Segment’s strength lies in its ability to facilitate a unified data strategy, making it a valuable asset for companies focused on personalized marketing, customer segmentation, and in-depth behavioral analysis.
Tableau, on the other hand, stands out for its exceptional data visualization and analysis capabilities. It’s the tool of choice for users seeking to transform complex data sets into intuitive, interactive dashboards and reports. With its user-friendly interface and extensive community support, Tableau is accessible to data professionals and business users alike, enabling a wide range of industries to uncover actionable insights and make data-driven decisions. Tableau’s versatility makes it ideal for organizations prioritizing data democratization and looking to empower their teams with self-service analytics.
Read Next:


Comments are closed.