WinSavvy Editorial Standards
How this article was created
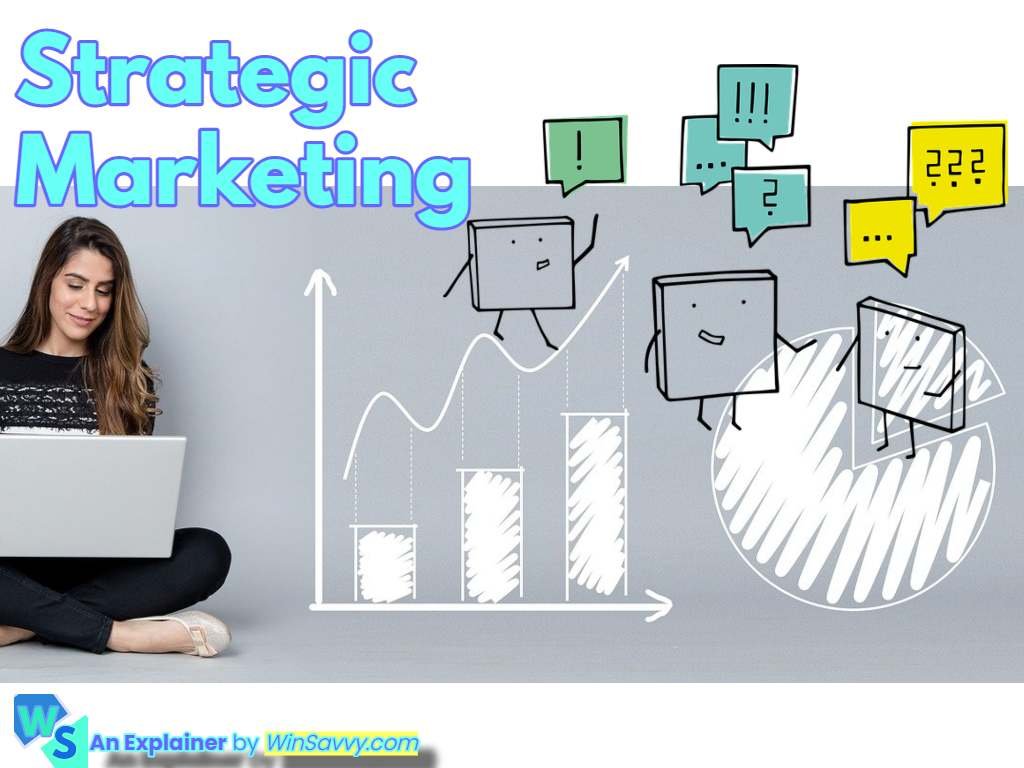
Understanding KPIs
Defining Key Performance Indicators
Key performance indicators, or KPIs, are like the yardsticks businesses use to figure out how they’re doing with their goals. Think of them as a quick peek under the hood of a company’s engine. KPIs help a business size up how well its different parts are running. Now, you might hear people talking about two main flavors: low-level and high-level indicators. These help keep tabs on the nitty-gritty department stuff as well as the big-picture company stuff. Companies break it down even further:
- Company-wide KPIs: They’re like the company’s health check-up report.
- Department-level KPIs: Zooms in on specific teams.
- Project or Sub-Department KPIs: Gives a detailed look at certain projects or sections.
Every level tells a different story, and together they spell out how business is really going.
Importance of KPIs
Why should you care about KPIs? Because they’re the cheat sheet businesses use to know if they’re on track. They’re these magic indicators that make it clear if a business is hitting its strategic milestones or just spinning its wheels. They’re super handy for deciding if operations are on point and making sense of lots of little details that might otherwise slip through the cracks.
Some KPIs zero in on the folks keeping the lights on—customers! Take the Customer Satisfaction Score (CSAT) and Customer Lifetime Value (CLV) for example. These track how much the customers dig what you’re doing and how long they’re likely to stick around. Getting these right can really boost how customers feel about the business and lead to a win-win where everyone’s happy.
Want more scoop on these metrics? Take a dive into what’s cooking in marketing by exploring resources about marketing performance metrics and measuring marketing effectiveness.
Types of KPIs
Figuring out the different Key Performance Indicators, or KPIs, is like figuring out which secret ingredients will finally make grandma’s famous pie perfect. These KPIs generally split into two camps: lagging and leading indicators, plus a side of financial and marketing metrics.
Lagging vs. Leading Indicators
Lagging and leading indicators are like the two sides of your rearview and front windshield—they serve different purposes.
- Lagging Indicators: These bad boys look backward, giving you the 411 on what already went down. Think of them as the highlight reel of your business, showing off accomplishments like revenue performance and net profit. They clue you in on growth and profitability but won’t exactly predict if you’re about to hit the jackpot next month.
- Leading Indicators: These guys are more the fortune-teller types, inching towards predicting future greatness. They steer actions toward hitting your business targets with real, tangible outcomes. Stuff like Pipeline Volume or how many chats, meetings, or emails your sales crew tackled. These indicators are gold for keeping tabs on sales buzz and for plotting tweaks early on (BMC, Geckoboard).
| Indicator Type | Description | Examples |
|---|---|---|
| Lagging | Mirrors past deeds | Revenue, Net Profit |
| Leading | Forecasts future trends | Pipeline Volume, Number of Sales Activities |
Financial KPIs
Financial KPIs are like your business’s financial report card telling you whether you’re passing with flying colors or need some tutoring. These numbers zoom in on the dollars, cents, and whatnot—covering everything from lives saved to operational efficiency.
-
Net Profit: The cash that’s left after every last bill is paid off. It’s the coin that remains when you’ve crossed off all the nitty-gritty expenses, taxes, and any debts (Investopedia).
-
Return on Investment (ROI): Crunches the numbers on how fat your paycheck from those marketing dollars is.
-
Customer Acquisition Cost (CAC): Figures out what it costs to charm a brand-new customer.
-
Gross Profit Margin: Looks at the percentage of revenue that’s the cherry on top after handling those pesky goods costs.
| Financial KPI | Definition |
|---|---|
| Net Profit | Hard-earned cash after expenses |
| ROI | Measure of marketing gains |
| CAC | Expense to win a new customer |
| Gross Profit Margin | Revenue after goods costs |
Marketing KPIs
Marketing KPIs are like the radar guiding your marketing ship—tracking how well your strategies hit the target. These KPIs zoom in on how customers react to marketing magic, showing the impact through metrics like conversion rates, brand awareness, or growth in sales. Here are some marketing KPIs playing on your stats team:
- Click-Through Rate (CTR): Counts how often folks click on ads after seeing them.
- Conversion Rate: Shows the percentage of people taking action, like buying your stuff or signing up for your newsletter.
- Customer Engagement Metrics: Keep tally of interactions with your marketing goodies, supplying the juice on how well those campaigns are landing.
| Marketing KPI | Definition |
|---|---|
| Click-Through Rate (CTR) | Ad clicks compared to views |
| Conversion Rate | Percentage of desired actions taken |
| Customer Engagement Metrics | Frequency of marketing interactions |
Getting friendly with KPIs in marketing lets decision-makers make savvy moves and soup up those marketing efforts. For tips on gauging your marketing mojo, check out our handy guide on measuring marketing effectiveness.
Implementing Effective KPIs
Every business wants to boost their game, and effective Key Performance Indicators (KPIs) are like a treasure map for marketing strategies. Below, let’s chew over how to make KPIs that actually work, the cool gadgets to keep tabs on ’em, and the rocky spots folks might hit along the way.
Tailoring KPIs for Success
First things first, if you’re gonna track KPIs and make it count, you gotta line ’em up with your big goals. Picture this: a company all about keeping customers around, they’re probably eyeing Customer Acquisition Cost (CAC) and Customer Lifetime Value (LTV).
It’s also smart to match KPIs with what your customers are up to — from the first time they hear your name to when they make a choice. This gives the marketing crew the full scoop on how things are rolling and what might need a boost (HBS Online).
Here’s a cheat sheet for those magic KPIs:
| KPI | Focus Area | Importance |
|---|---|---|
| Click-Through Rate (CTR) | Awareness | Checks out how curious folks are |
| Conversion Rate | Consideration | Weighs the heft of your plans |
| Customer Acquisition Cost (CAC) | Decision | Keeps tabs on what it costs to snag a buyer |
| Customer Lifetime Value (LTV) | Retention | Guesstimates what a customer’s worth over time |
Tools for Tracking KPIs
Staying on top of KPIs isn’t just about knowing what’s up, but having the right gear to do it. Think tools like In-Tool Analytics, Customer Relationship Management (CRM) Systems, Attribution Platforms, and Custom Dashboards. Imagine having a clear look at what’s happening across all your lines in the water (Improvado Blog).
These gadgets mean you can see how things are going in real-time, letting you tweak your moves if something’s off. When picking tools, keep an eye out for ones that are easy to use, fit snugly with what you’ve already got, and spit out reports that make sense.
Challenges in KPI Tracking
Even with the best gear, marketers still hit snags. Turns out, only 23% feel they’re nailing it with the KPIs they follow, showing there’s a bit of confusion over what counts (HBS Online).
- Defining Relevant Metrics: Pinpointing which indicators to trust can be tricky.
- Data Quality: Shoddy or half-baked info can skew the view.
- Resource Constraints: Not enough time or funds can put the brakes on tracking KPIs properly.
- Integration Issues: Mixing data from all kinds of spots can throw a wrench in things.
The secret to dodging these hurdles is figuring out what success looks like, investing in sorting out your data, and having the right set-up to keep tabs. Once you can smooth out these bumps, the real power of KPIs becomes clear, giving your marketing strategy a boost. Check out more on how to crank up your marketing machine with our guides on marketing performance metrics and marketing financial analysis.
Essential Marketing KPIs
If you’re a CEO, business owner, or marketing guru aiming to boost those profits, understanding key performance indicators (KPIs) is your golden ticket. Buckle up as we uncover the essential KPIs that can help you keep tabs on how well you’re doing.
Click-Through Rate (CTR)
Ever wonder if your ad clicks with folks? That’s where Click-Through Rate (CTR) comes into play. It’s all about the percentage of people clicking your link, ad, or email against those who just eyeballed it. A snazzy CTR means your message is right on the money for your audience, making it a biggie for measuring campaign mojo.
The math to figure out CTR goes like this:
[
\text{CTR} = \left( \frac{\text{Number of Clicks}}{\text{Total Impressions}} \right) \times 100
]
| Metric | Example |
|---|---|
| Number of Clicks | 200 |
| Total Impressions | 10,000 |
| CTR (%) | 2.0% |
Want pointers to jazz up your marketing game? Check out our tips on measuring marketing effectiveness.
Conversion Rate
Conversion Rate is where the magic happens—how many visitors do what you want, whether shopping or signing up. This KPI uncovers how well your marketing pushes the right buttons to seal the deal.
To get the conversion rate:
[
\text{Conversion Rate} = \left( \frac{\text{Number of Conversions}}{\text{Total Visitors}} \right) \times 100
]
| Metric | Example |
|---|---|
| Number of Conversions | 50 |
| Total Visitors | 1,000 |
| Conversion Rate (%) | 5.0% |
Google Analytics can help you track these rates like a pro and decode what makes those customers tick (HBS Online).
Return on Investment (ROI)
Let’s talk dollars and sense—Return on Investment (ROI). It’s about checking if your marketing bucks bring back enough juice. This KPI tells you what’s working and helps divvy up that budget wisely.
The ROI cheat sheet is:
[
\text{ROI} = \left( \frac{\text{Revenue} – \text{Cost of Investment}}{\text{Cost of Investment}} \right) \times 100
]
| Revenue | Cost of Investment | ROI (%) |
|---|---|---|
| $10,000 | $2,000 | 400% |
Swing by for more on sizing up your marketing impact in our marketing return on investment guide.
Customer Acquisition Cost (CAC)
Let’s talk spending to snag new customers. Enter Customer Acquisition Cost (CAC), which shows what it costs to lure a fresh face into your flock. Get a grip on this metric to see if your marketing budget’s hitting the mark.
Here’s the CAC formula:
[
\text{CAC} = \frac{\text{Total Marketing and Sales Expenses}}{\text{Number of New Customers Acquired}}
]
| Total Marketing & Sales Expenses | New Customers Acquired | CAC |
|---|---|---|
| $5,000 | 50 | $100 |
Knowing CAC is like having a GPS for your budget, steering you towards smart resource allocation. Dig deeper with our piece on marketing cost analysis.
Keep an eye on these marketing KPIs, and your biz will have a clearer path for making savvy decisions to rev up strategies and score better results.
Strategic KPIs in Marketing
If you’re looking to keep tabs on your business’s vibe and make some smart moves, Strategic Key Performance Indicators (KPIs) in marketing are basically your Swiss Army knife. They help you figure out what your customers are really thinking and if they’re sticking around for the long haul. Some big players in this game are the Customer Satisfaction Score (CSAT), Net Promoter Score (NPS), and Lifetime Value of a Customer (LTV). These give you the scoop on how happy your customers are, how loyal and what’s the cash they’re bringing your way.
Customer Satisfaction Score (CSAT)
Customer Satisfaction Score, affectionately known as CSAT, is your direct line to how people feel about your stuff. Does it rock their socks, or is it just meh? Usually, you’re asking folks to rate their happiness with your world on a scale between 1 to either 5 or 10.
The way to crack the CSAT code is pretty simple:
[ \text{CSAT} = \left( \frac{\text{Number of Satisfied Customers}}{\text{Total Number of Respondents}} \right) \times 100 ]
So, say you’ve got 80 happy campers out of 100 responses; your score’s a sweet 80%.
| Customer Satisfaction Score (CSAT) | Example |
|---|---|
| Wholly Happy Customers | 80 |
| Total Respondents | 100 |
| CSAT Calculation | 80% |
A high CSAT score and you’re in biz – it means people might just come back for more.
Net Promoter Score (NPS)
NPS is like the popularity contest of your business; it checks if your customers are singing your praises or just whispering about you. On a scale from 0 to 10, you find out if customers would recommend you to their buddies.
Here’s how that shakes out:
- Promoters (score 9-10) – Fan club members who buy again and tell their friends.
- Passives (score 7-8) – They’re cool with you but might flirt with the competition.
- Detractors (score 0-6) – Not happy campers and could hurt your reputation.
Your NPS is all about the balance:
[ \text{NPS} = \text{% of Promoters} – \text{% of Detractors} ]
| Net Promoter Score (NPS) | Example |
|---|---|
| Promoters | 60% |
| Detractors | 10% |
| NPS Calculation | 50 |
A high NPS suggests you’ve got a loyal following, which is a game-changer for growth.
Lifetime Value of a Customer (LTV)
Lifetime Value is all about the dollar signs. It tells you what a customer’s worth over the whole time they’re hanging out with you. It’s gold for sorting out how much you can splash on bringing in new folks versus the returns.
To do the math:
[ \text{LTV} = \text{Average Purchase Value} \times \text{Average Purchase Frequency} \times \text{Customer Lifespan} ]
So if someone drops $100 per visit, swings by six times a year, and sticks with you for five years, here’s what you’ve got:
[ LTV = 100 \times 6 \times 5 = 3000 ]
| Lifetime Value (LTV) | Example |
|---|---|
| Average Spend | $100 |
| Shopping Frenzy | 6 times/year |
| Customer Relationship | 5 years |
| LTV Calculation | $3000 |
Nailing LTV means you can plan spending like a pro (HubSpot) and make your marketing dollars count.
So, diving into these KPIs—CSAT, NPS, and LTV—gives you a treasure trove of insights to pump up your marketing game and fatten that bottom line. For more insights to boost your marketing mojo, check out our piece on marketing performance metrics.
Aligning Sales and Marketing KPIs
To really get some juice out of a business strategy, syncing up sales and marketing KPIs is where it’s at. These two departments are like peanut butter and jelly, meant to work together for that perfect blend that really packs a punch.
Misalignment Issues
Sales and marketing going their separate ways can throw a real wrench in the works. Picture a football game where the quarterback and receiver can’t agree on the play—chaos and missed touchdowns. It’s kinda like that when the lead lifecycle doesn’t sync. Leads start their journey under marketing’s wing before being passed to sales, and if the handoff isn’t smooth, it’s like dropping the ball right before the endzone. According to Ruler Analytics, having different tools and data blocks doesn’t help either. It’s like trying to assemble a jigsaw puzzle with missing pieces. And don’t get started on how that budgeting? Yikes.
Metrics for Collaboration
To make this peanut butter and jelly dream team work, you need shared KPIs that both departments cheer for. Here are some MVPs in this game:
| Metric | Description |
|---|---|
| Number of Leads Generated | Checks how good marketing’s fishing skills are at reeling in those potential customers. |
| Lead Conversion Rate | Measures how many folks take the bait and buy in, showing marketing’s knack at finding solid leads. |
| Sales Revenue | Tallies up the cash brought in from those leads marketing nudged in the right direction. |
| Customer Retention Rate | Looks at how well sales and marketing tag team to keep customers coming back for more. |
| Cost Per Lead | Puts the magnifying glass on how much dough marketing is burning to land each lead. |
Get these metrics rolling, and suddenly you’re speaking the same language. It’s like giving both teams the same playbook, making life less stressful and boosting the whole operation (marketing performance metrics).
Having regular pow-wows and sharing the scorecard on these KPIs helps to keep everyone on the same page and out of the penalty box. Fixing the whole misalignment fiasco makes your business strategy sharper than a tack and can really get that bottom line singing.
Measuring Business Health
Keeping a business running smoothly is like juggling chainsaws—it’s all about balance. Watching those vital signs is the secret sauce to thriving. And what are these signs, you may ask? They’re those pesky little performance metrics ticking away beneath the surface of processes, finances, and human resources. When folks like CEOs, business owners, and marketing whiz kids glance at these metrics, they spot areas to tweak and tinker, boosting that elusive bottom line.
Monitoring Process KPIs
Process KPIs are a company’s operational pulse. Think of ’em as a backstage pass to your own business show. They point out snags, squash waste, and fine-tune efficiency until everything hums along just right. Some headliner process KPIs that deserve a spot in your company’s playlist:
| Process KPI | Description |
|---|---|
| Cycle Time | How long does it take to get from point A to point B in your process? |
| Process Efficiency | Are you making the most of your resources or just burning daylight? |
| Error Rate | Oops moments in your process. How often are they happening? |
| Return on Investment (ROI) | Is the cash you’re sinking into your processes paying off? |
Getting a handle on these performances lets you make sharp decisions without breaking a sweat. If you’re itching for more on checking marketing performance metrics, grab a seat here.
Financial Metrics Overview
Financial metrics are the dollar signs blinking on your company radar. They’re the yardsticks for economic stardom, allowing businesses to measure up against their wildest dreams (and benchmarks). These KPIs are like a backstage pass to your company’s financial gig:
| Financial Metric | Description |
|---|---|
| Revenue Growth Rate | Who doesn’t like seeing more cash flow in than out over time? |
| Profit Margin | How much dough are you rolling in after the bills are paid? |
| Return on Assets (ROA) | Are your assets pulling their weight or just collecting dust? |
| Customer Acquisition Cost (CAC) | What’s the price tag on roping in a new customer? |
These financial metrics help you strut your stuff in marketing budget planning and financial performance evaluation, keeping your fiscal health in tip-top shape and ripe for opportunity.
Human Resources KPIs
Human Resources KPIs are like your talent scouts, measuring how well your team struts their stuff. Tap into these metrics, and you’ll have a spotlight on how well you’re optimizing that human know-how. Important HR KPIs that won’t disappoint:
| HR KPI | Description |
|---|---|
| Employee Turnover Rate | How often are employees bidding you farewell (and at what cost)? |
| Employee Satisfaction Score | Is your team happy? Or are they throwing tomatoes at the stage? |
| Training Effectiveness | Did those training sessions elevate skills, or was it all just a snooze-fest? |
| Time to Hire | How quick are you snagging that rockstar for the next big role? |
Keep a close watch on these HR KPIs, and you’ll improve measuring marketing effectiveness by ensuring the stars on your team are pushing performance into overdrive.
By keeping tabs on this diverse set of KPIs, businesses can unlock a treasure trove of insights. It’s like having your business oracle, guiding you to make decisions that sharpen your operations and rev up performance.
Optimization Through KPIs
Getting the hang of key performance indicators (KPIs) can give a serious boost to a company’s marketing game. This means setting clear goals, keeping tabs on progress, and picking up on patterns and trends.
Setting Measurable Results
Setting clear, measurable goals is where it all starts with any KPI setup. Companies can figure out what to aim for based on their goals and then see how they’re doing against these targets. Every quarter, businesses need to pin down numbers that really measure how they’re moving forward. Doing this shows where things could do with a little work, making sure everything lines up with the bigger picture.
| KPI Metric | Example Goal | Measurement Frequency |
|---|---|---|
| Conversion Rate | Increase by 15% | Weekly |
| Customer Acquisition Cost | Reduce to $100 | Monthly |
| Return on Investment (ROI) | Achieve 200% | Quarterly |
Tracking Progress Over Time
Keeping an eye on KPI performance over time lets companies make smart decisions when planning strategies. Watching KPIs every week or month helps them tweak things based on what’s happening. This diary of performance helps spot shifts, letting businesses know when they’ve hit their marks or need to rethink things. Good KPI tracking gives a current snapshot of how things are going with business health and marketing pushes.
Analyzing Patterns and Trends
Regularly sifting through KPI data helps businesses spot and get familiar with trends in their marketing strategies. By catching onto these patterns, companies can get a sense of business cycles, improve performance, and eventually make decisions that push growth. Spotting these trends lets businesses tweak their plans to fit what the market wants. These bits of insight into trends and performance work as a vital tool for leaders to keep things accountable and stay flexible with changes in the marketplace.
Using KPIs wisely gets you not just insight into how marketing is doing but also helps build smart marketing financial plans and keep the business on a healthy path by making smart choices.